Today is really easy for us to train and use machine learning model. A lot of libraries in many programming languages implement machine learning models for us and we have to just call a function and voila we are using complex machine learning models.
But do we know how those models work? What are their goals? And if the library implementation of a specific model does not fit our needs do we know how to modify it?
Thinking about those questions, that the motivation to write those series of posts came to me.
In this post you will learn:
- What is linear regression?
- What is gradient descent?
- How to implement a linear regression from scratch only using NumPy.
Introduction
From the simplest machine learning models like one variable linear regression to complex deep neural networks all machine learning models have the same goal, which is to find an equation that can answer a specific problem.
So, to start this series of posts, I will begin showing you how you can build your linear regression model from scratch using only Python Numpy.
Also read: 6 Machine Learning certifications you need to get a better job and salary in AI
Linear regression
In linear regression, we want to predict a continuous value using as input some ‘Xs’ values.
The simple linear regression formula is
Y = aX + b
‘Y’ is the dependent variable, ‘X’ is the explanatory variable, ‘b’ is the slope of the line, and ‘a’ is the intercept variable in other words the value of ‘Y’ when ‘X’ is zero. On a linear regression, we want to find the values of ‘a’ and ‘b’ that minimizes the prediction errors.
How do I know that I can use linear regression?
One of the easiest ways to see if a linear regression would be a good model to use is to build a scatterplot of the data. A scatterplot is a simple graph that uses cartesian coordinates to draws (X, Y) points.
If the plot shows a linear association between the dependent and explanatory variable like the image below you can try to fit a linear model.
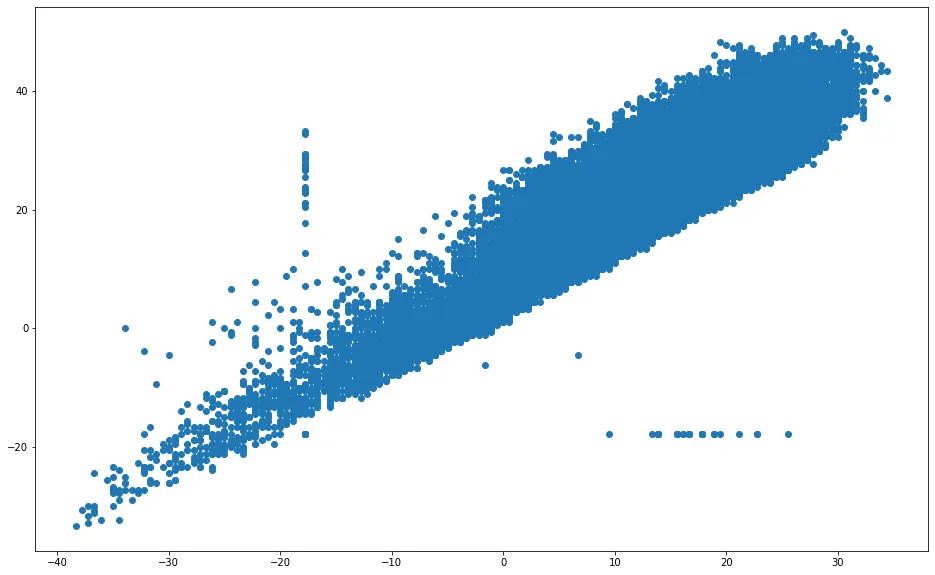
In this image we can see a positive linear association between the dependent and explanatory variables, that is not the case of the image below. We cannot draw a simple line that would be a good fit for this data.
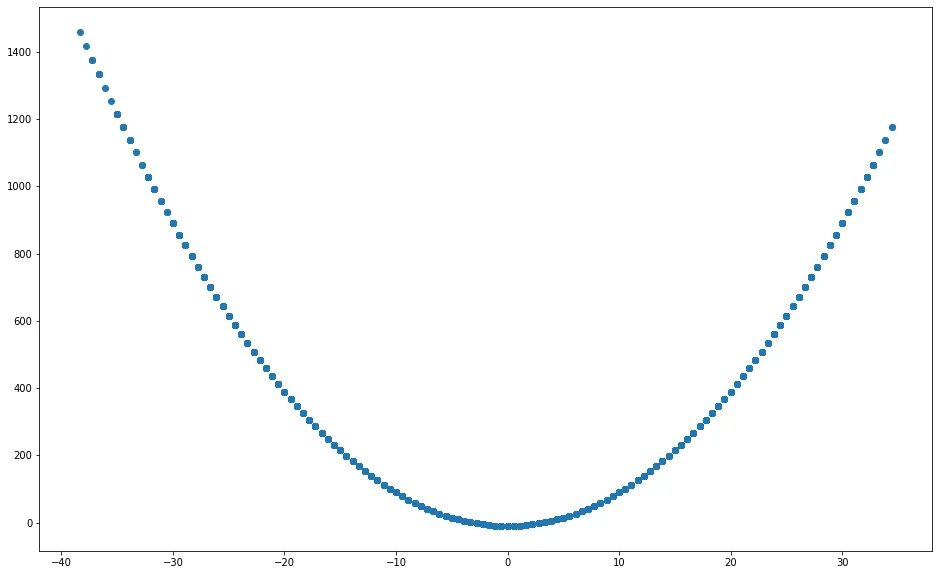
But how do we know our linear regression is getting it right? For knowing that we need to calculate the cost function.
Cost function
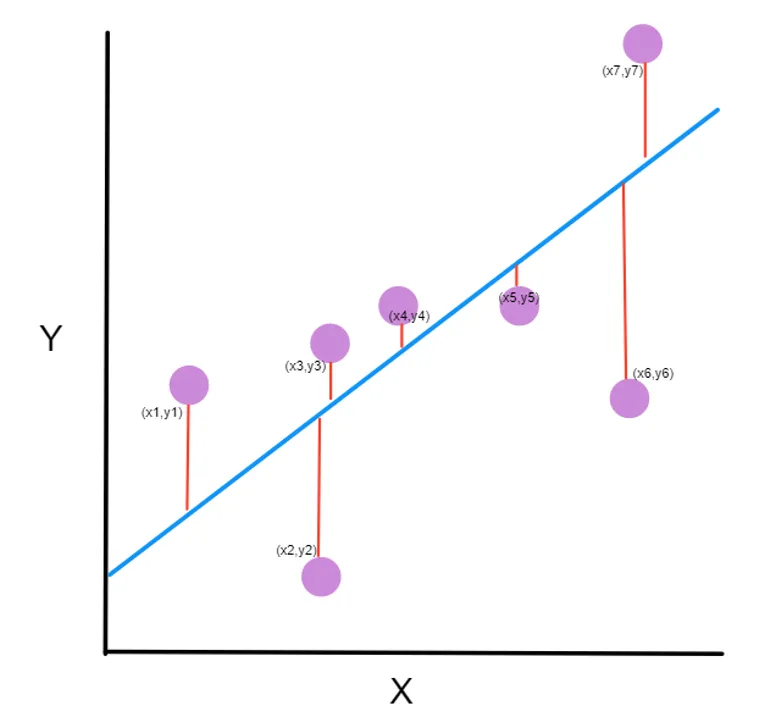
Intuitively to find the errors of a linear regression function we just need to get the sum of all differences between the predicted y value (ÿ) and the actual point (y), after that we can divide this value with the number of points (n) to get the mean.
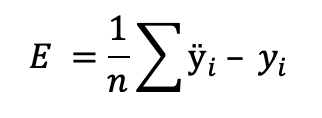
But if our ‘ÿ’ value it’s smaller than the ‘y’ value the error will decrease and it’s not that behavior that we want. So, to avoid this behavior we can get the absolute value of the equation or squared the equation.
Because we are going to take the derivative of this function, later on, and the derivate of a squared function is easier to solve, we will square the equation.
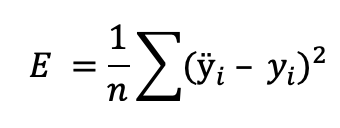
This formula is called Mean Square Error (MSE).
But how can we improve our linear regression, reducing the value of the cost function? Using a technique called Gradient Descent.
Gradient Descent
Gradient Descent is a technique used to find a minimum of a function. In Linear Regression, we will use Gradient Descent to find the values of ‘a’ and ‘b’ that minimizes the cost function.
The Gradient Descent is described in the image below. We first start with random ‘a’ and ‘b’ values and the initial error is where the ball is drawn.
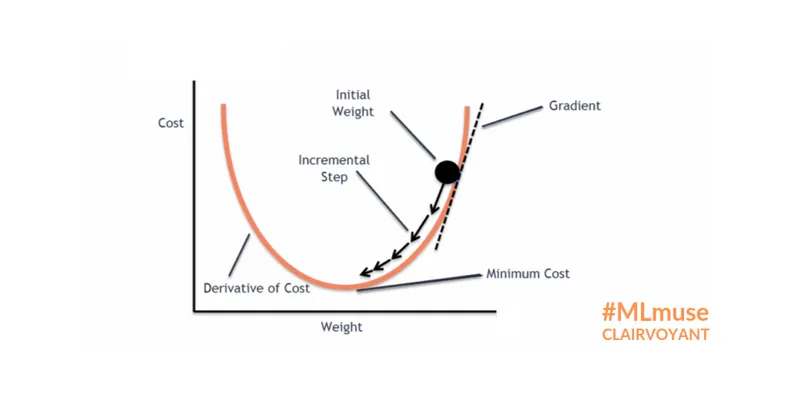
After that, we want to make steps toward the bottom of this curve. But we don’t want to make big steps because by doing that we will take too long to achieve the bottom or even worse never achieve it.
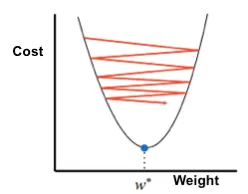
Also, we do not want to make tiny steps that will take too long to achieve the bottom. So, we need a step of just the right size. This step size is tunned by a factor called learning rate (L). Usually, L is some small value like 0.0001.
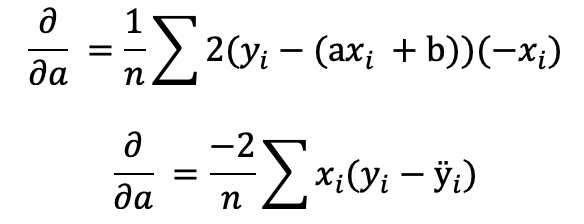
To optimize the cost function we need to get its derivative by doing the steps below.
1- Replace ÿ for ax + b

2- Calculate the partial derivative with respect to ‘a’
3- Calculate the partial derivative with respect to ‘b’

4- Update the value of ‘a’ and ‘b’ in each iteration
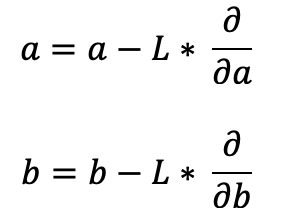
5- Finally, repeat this process m times or until the error is less than some tolerance.
Implementing in Python
Importing the libraries needed.
import numpy as np
import pandas as pd
import matplotlib.pyplot as plt
from warnings import warn
Function to implement the linear regression
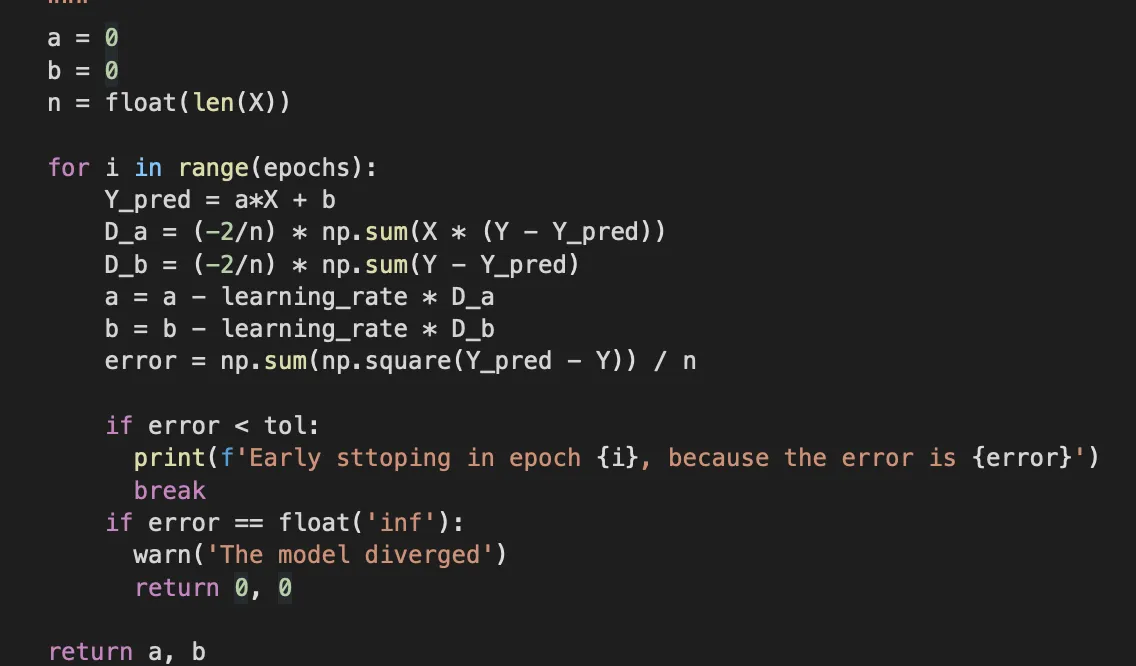
To implement the linear regression, we
- Start by setting the ‘a’ and ‘b’ to zero and getting the number of points ‘n’.
- Get the predictions
- Get the derivatives with respect to ‘a’ and ‘b’
- Update the ‘a’ and ‘b’ coefficients
- Get the error
- Repeat this process until i is less than epoch or the error is less than the tolerance
- Return the updated ‘a’ and ‘b’

This snippet of code checks if the gradient descent diverged.
To test if this code was working as expected, I used the Weather Conditions in World War Two Kaggle dataset to see if I could fit a linear regression to explain the relationship between the MinTemp and the MaxTemp.
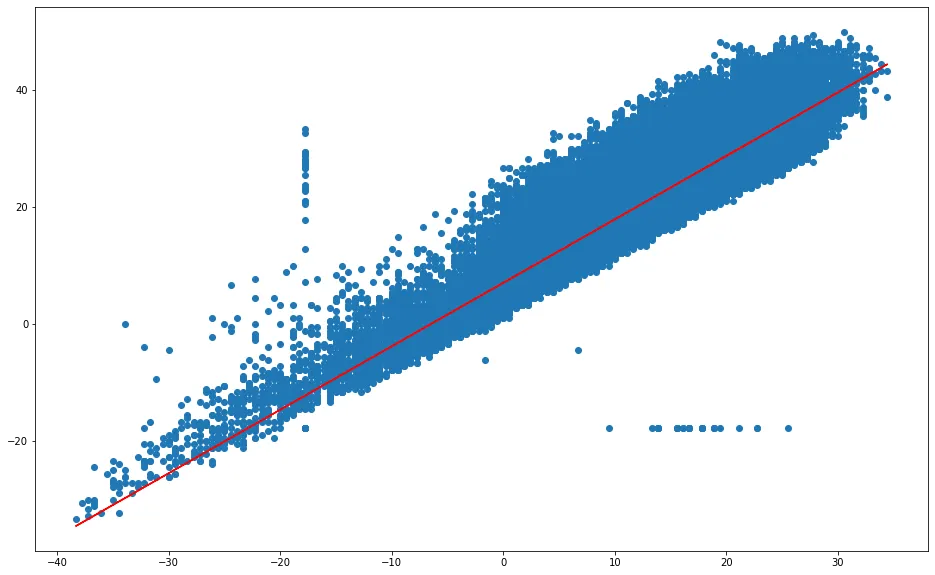
You can check the code used to write this post in this Colab notebook. Feel free to reach me with any comments on my Linkedin account and thank you for reading this post.
If you like what you read be sure to 👏 it below, share it with your friends and follow me to not miss this series of posts.