Python offers a wide range of data visualization libraries that turn complex data into clear pictures. These tools cover everything from simple static charts to interactive, web-based dashboards. Each library has its own strengths, suited to different tasks and skill levels. Python sits at number one on the TIOBE index through 2025 and remains one of the most-used languages in the Stack Overflow 2025 Developer Survey, and its data stack is a big reason why.
Some libraries are great for quick, clear plots. Others support deep customization or easy sharing of visuals online. In this guide we look at the 10 most popular Python visualization libraries, explain what each does best, show a short code example, and help you pick the right tool for your next project. Let's start with a quick cheat sheet, then go library by library.
Hit deadlines, every time. Hire high-performing Python developers from a global network of 30,000+ human-vetted engineers from LATAM and CEE, the top 1% of 2.5 million applicants, ready to join your team in 48 hours.
5 Key Takeaways
- Static charts: start with Matplotlib for full control, then add Seaborn for nicer statistical defaults with less code.
- Interactive charts: Plotly, Bokeh, and Altair all render to the web with zoom, pan, and tooltips.
- Full data apps: Dash lets you ship an interactive web app in pure Python, with no HTML, CSS, or JavaScript.
- Fast exploration: PyGWalker turns a Pandas DataFrame into a Tableau-style drag-and-drop UI inside Jupyter.
- Pick by the job: static vs interactive, notebook vs web app, and dataset size narrow the choice in seconds. Use the table below.
Quick Comparison: Which Library for Which Job
Keep this table next to your editor. It maps each library to the kind of work it suits best, whether it produces interactive output, and what you get out the other end.
| Library | Best for | Interactive | Typical output |
|---|---|---|---|
| Matplotlib | Static, highly customizable 2D plots | No | PNG, PDF, SVG |
| Seaborn | Statistical charts with clean defaults | No | Matplotlib figures |
| Plotly | Interactive web charts, 3D, sharing | Yes | HTML, web |
| Bokeh | Dashboards and streaming, real-time data | Yes | HTML, web |
| Altair | Declarative statistical charts | Yes | HTML, Vega-Lite |
| Pygal | Small, scalable SVG infographics | Light | SVG |
| Plotnine | ggplot2 grammar of graphics | No | Static images |
| Geoplotlib | Small to medium geographic maps | Light | Map windows |
| Dash | Full data apps in pure Python | Yes | Web app |
| PyGWalker | Drag-and-drop exploration in Jupyter | Yes | Notebook UI |
1. Matplotlib
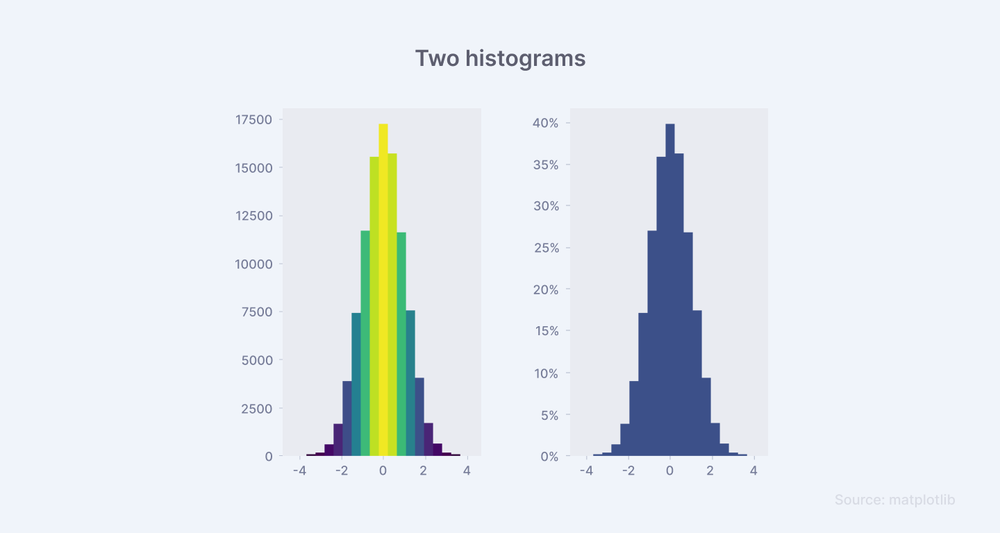
Matplotlib is a foundational part of Python's data visualization toolkit. It is an open-source framework for displaying complex patterns in a clear, meaningful way.
Matplotlib gives you a wide selection of plot types, customization tools, and helper functions. It covers line plots for trends, bar charts for comparisons, and scatter plots for relationships between variables. It also supports multi-panel charts for deeper analysis of complex datasets, and its animation module lets you build dynamic visuals that show change over time.
Advantages
- Offers an animation module to show changes over time.
- Widely used and trusted in the data science community.
- Well documented, with many tutorials and examples.
- Easy to get started for beginners.
- Works smoothly with NumPy and Pandas.
- Highly customizable for advanced visualizations.
- Supports many output formats (PNG, PDF, SVG, and more).
- Good for static, animated, and interactive plots.
Code Implementation
import matplotlib.pyplot as plt
import numpy as np

# Simple line plot
x = np.linspace(0, 10, 100)
y = np.sin(x)
plt.plot(x, y)
plt.title('Simple Line Plot')
plt.xlabel('x')
plt.ylabel('sin(x)')
plt.show()
2. Seaborn
Seaborn extends Matplotlib and raises the quality of statistical visuals. Matplotlib provides the foundation, and Seaborn makes statistical graphs more attractive and easier to read through a higher-level interface.
Seaborn produces clear graphics with less code. It is strong at sophisticated plots such as heatmaps that reveal patterns and pair plots that show correlations across many variables. It integrates directly with Pandas data structures, so it suits users of every skill level.
Advantages
- Makes attractive, easy-to-read statistical graphs by default.
- Clean syntax reduces the amount of code needed.
- Built on Matplotlib but offers a higher-level interface.
- Great for both beginners and advanced users.
- Integrates well with Pandas DataFrames.
- Supports heatmaps, violin plots, and pair plots with little effort.
- Handles themes, color palettes, and aesthetics automatically.
- Helps you uncover patterns and relationships quickly.
Code Implementation
import seaborn as sns
import pandas as pd

# Load example dataset
tips = sns.load_dataset("tips")

# Simple heatmap
sns.heatmap(tips.corr(numeric_only=True), annot=True)
plt.show()

# Pair plot
sns.pairplot(tips, hue="sex")
plt.show()
3. Geoplotlib
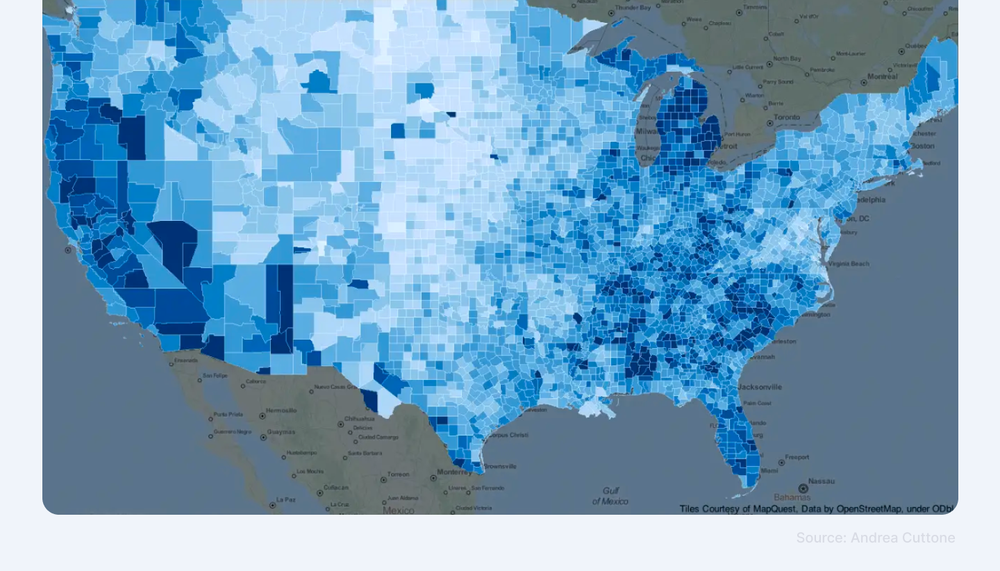
Geoplotlib is built for interactive maps and geographic visualizations. It supports several map projections, and its straightforward interface makes it friendly for newer developers.
Geoplotlib may not be enough for very large or complex applications, but it is an excellent choice for simple and medium-sized mapping tasks.
Advantages
- Simple and easy to use for geographic data visualization.
- Good fit for small to medium-sized projects.
- Needs minimal setup and code to generate maps.
- Built-in support for heatmaps and dot maps.
- Lightweight, with no heavy dependencies.
- Helps you create clear insights from spatial data.
Code Implementation
import geoplotlib
from geoplotlib.utils import read_csv

# Load example data
data = read_csv('data.csv')

# Simple point map
geoplotlib.dot(data)
geoplotlib.show()
4. Plotnine (ggplot2 Style)
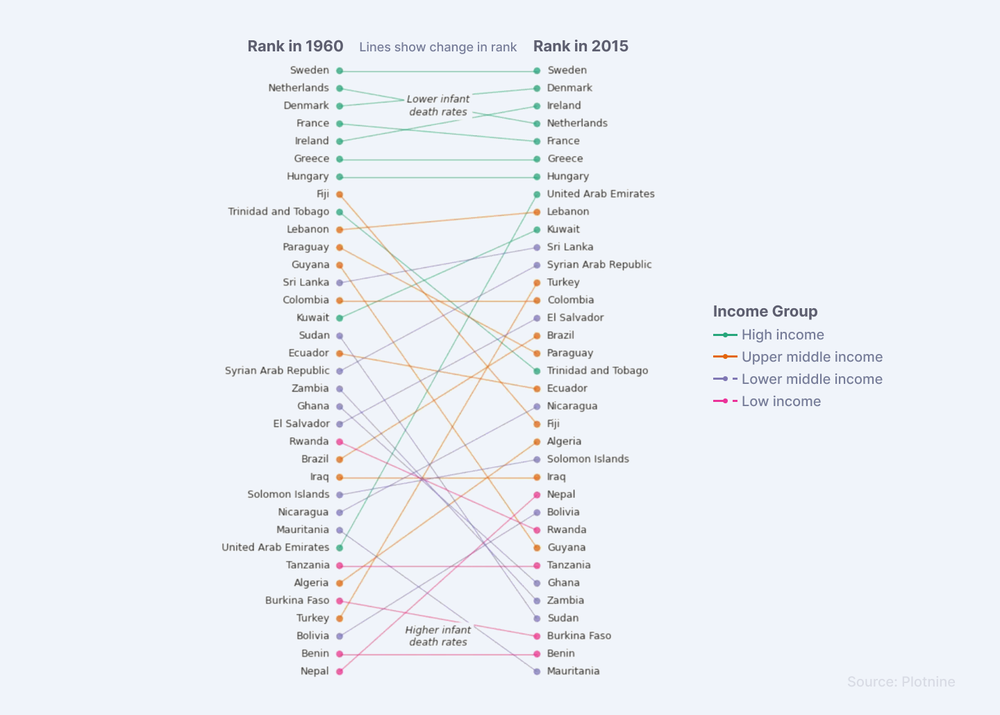
Plotnine is a strong choice for developers who want a high-quality visualization toolkit that follows the ggplot2 grammar of graphics. You build plots layer by layer, adding points, lines, and text to reach a complete result.
It is most effective for simple to moderately complex tasks, and you should not expect full low-level customization. It fits broad visualization work that is not the central focus of your project.
Advantages
- Follows the ggplot2 style, easy for R users to adapt.
- Consistent, readable syntax for building plots in layers.
- Ideal for simple to moderately complex visualizations.
- Great for publication-quality statistical graphics.
- Easy to use inside Pandas data science workflows.
- Reduces boilerplate compared with other libraries.
Code Implementation
from plotnine import ggplot, aes, geom_line
import pandas as pd

# Load example data
data = pd.DataFrame({
    'x': range(10),
    'y': range(10)
})

# Simple line plot
(ggplot(data, aes('x', 'y')) + geom_line())
Hit deadlines, every time. Hire high-performing Python developers from a global network of 30,000+ human-vetted engineers from LATAM and CEE, matched to your team in 48 hours.
5. Plotly
Plotly is a popular Python visualization library known for its versatility in online settings. It covers a wide range of chart types, from basic line charts to complex 3D visuals.
Plotly stands out for programmatic interactivity, which lets developers engage their audience and share dynamic visualizations. Building interactive web charts is straightforward, and Plotly graphics drop into web apps so users can explore data directly. It is a useful bridge between data science and web-based applications.
Advantages
- Creates interactive, web-friendly visualizations with ease.
- User-friendly API builds complex charts with less code.
- Supports many chart types, including 3D and animations.
- Works well in Jupyter Notebooks and web apps.
- Ideal for team projects that need sharing and collaboration.
- Integrates with Dash for app development.
Code Implementation
import plotly.express as px

# Load example data
df = px.data.iris()

# Simple scatter plot
fig = px.scatter(df, x="sepal_width", y="sepal_length", color="species")
fig.show()
6. Bokeh
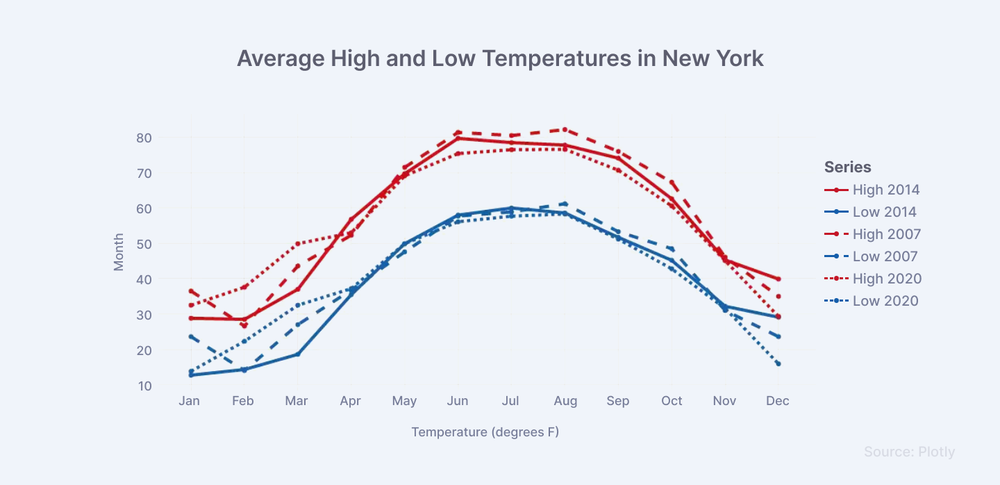
Bokeh is a leading Python library for interactive, real-time visualization in modern apps. Its concise syntax and support for streaming data make it a strong choice for changing datasets. Bokeh shines when interaction matters, such as in dashboards or real-time monitoring.
Bokeh handles large and fast-changing datasets well, which makes it useful for data scientists and developers alike. It converts complex data structures into interactive charts so users can spot real-time patterns and trends. It works for financial reporting, IoT monitoring, and dynamic reports.
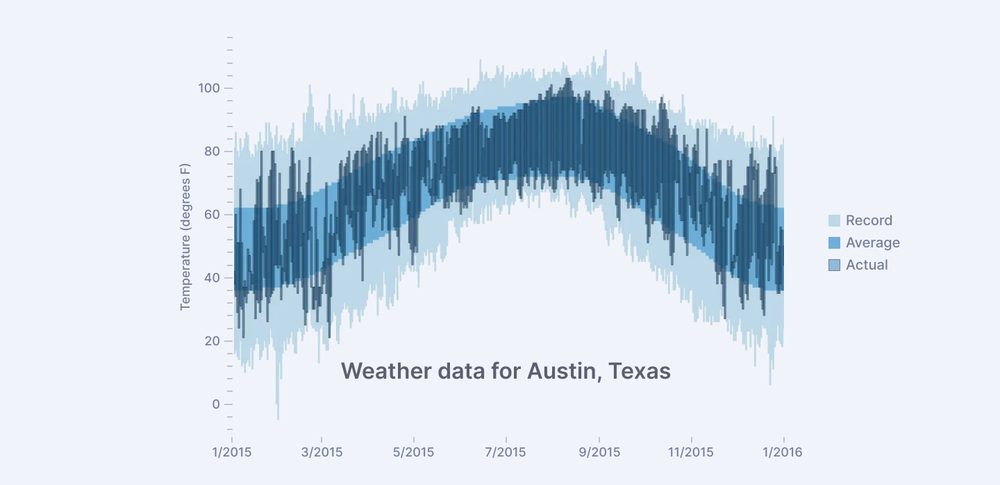
Interactive weather statistics for three cities (Bokeh)
Advantages
- Converts complex data into interactive visuals automatically.
- Great for dashboards and real-time monitoring tools.
- Supports zoom, pan, and tooltips.
- Integrates well with web technologies and Python backends.
- Flexible enough for data scientists and developers.
- Works in Jupyter Notebooks and web browsers.
Code Implementation
from bokeh.plotting import figure, show
from bokeh.io import output_notebook
output_notebook()

# Simple line plot
p = figure(title="Simple Line Plot", x_axis_label='x', y_axis_label='y')
p.line([1, 2, 3, 4, 5], [6, 7, 2, 4, 5], legend_label="Temp.", line_width=2)
show(p)
7. Altair
Altair is a widely used Python visualization library that streamlines interactive charts through a declarative style. It is built on Vega-Lite, so you describe what you want and the library renders it. The result is intricate plots with minimal code and high clarity.
Seamless integration with Pandas is a core advantage. You can turn datasets into clear graphics that give instant insight. Altair supports scatter plots, bar charts, line graphs, and more, which makes it a flexible tool for data scientists and analysts who want intuitive visualization.
Advantages
- User-friendly interface for beginners and experts.
- Quickly creates high-quality graphics.
- Supports many types of plots.
- Versatile across fields and use cases.
- Uses a simple, declarative syntax.
- Integrates well with Jupyter Notebooks.
Code Implementation
import altair as alt
import pandas as pd

# Load example data
source = pd.DataFrame({
    'a': ['A', 'B', 'C', 'D', 'E'],
    'b': [5, 3, 6, 7, 2]
})

# Simple bar chart
chart = alt.Chart(source).mark_bar().encode(
    x='a',
    y='b'
)
chart.show()
Build with high-performing Python developers vetted for soft and tech skills. Get 3 to 5 interview-ready, human-vetted candidates in 48 hours. Start hiring.
8. Pygal
Pygal is effective for basic interactive data displays. With minimal code you can generate striking infographics, and because the charts are vector-based they stay sharp at any size.
Pygal is not suited to very large projects and lacks extensive customization. Compared with the other libraries here, it has a smaller community.
Advantages
- Simple and easy to use, good for small projects.
- Creates appealing graphics with little effort.
- Focuses on SVG charts for high-quality, scalable visuals.
- Generates dynamic, interactive charts.
- Suitable for infographics and presentations.
- Limited customization keeps it straightforward.
Code Implementation
import pygal

# Simple line chart
line_chart = pygal.Line()
line_chart.title = 'Simple Line Chart'
line_chart.x_labels = map(str, range(2002, 2013))
line_chart.add('Fibonacci', [0, 1, 1, 2, 3, 5, 8, 13, 21, 34, 55])
line_chart.render_in_browser()
9. Dash
Dash, built by Plotly, sits at the intersection of data science and web development. It lets you build interactive web apps in pure Python, with no HTML, CSS, or JavaScript required. Its tight integration with Plotly lets data scientists turn insights into shareable dashboards.
The main benefit of Dash is combining data science with web development. By pairing Plotly charts with custom components, you can build web apps that are both dynamic and responsive.
Advantages
- Build interactive web apps using only Python.
- No need to know HTML, CSS, or JavaScript.
- Integrates with Plotly for advanced visualizations.
- Ideal for turning models and insights into dashboards.
- Great for sharing results with stakeholders.
- Supports custom UI components for flexibility.
- Highly customizable and responsive design.
- Works in Jupyter and production environments.
- Backed by a strong community and frequent updates.
Code Implementation
import dash
from dash import dcc, html

app = dash.Dash(__name__)
app.layout = html.Div([
    dcc.Graph(id='example-graph', figure={
        'data': [{'x': [1, 2, 3], 'y': [4, 1, 2], 'type': 'bar', 'name': 'SF'},
                 {'x': [1, 2, 3], 'y': [2, 4, 5], 'type': 'bar', 'name': 'NYC'}],
        'layout': {'title': 'Dash Data Visualization'}
    })
])

if __name__ == '__main__':
    app.run(debug=True)
10. PyGWalker
PyGWalker is a fast-growing tool that turns a Pandas DataFrame into an interactive dashboard inside Jupyter Notebook. Inspired by Tableau, it offers a drag-and-drop interface for building charts. There is no need to write extra code for visuals. You load your data and start exploring. It is built on Apache ECharts, so charts are responsive and customizable.
Advantages
- Filter, group, and slice data directly in the notebook.
- Great for quick exploration, prototyping, and sharing findings.
- Actively developed with regular updates and new features.
- Ideal for analysts who want GUI-based insights without switching tools.
- Open source and easy to install with pip:
pip install pygwalker.
Code Implementation
import pygwalker as pyg
import pandas as pd

df = pd.read_csv("your_data.csv")
pyg.walk(df)
Where These Libraries Win in Production
The right tool depends on where the chart ends up. A few patterns show up again and again on real teams:
- Research and reports: Matplotlib and Seaborn produce the static figures that go into papers, PDFs, and slide decks.
- Internal analytics dashboards: Plotly and Dash let a small team ship a shareable web app without a frontend engineer.
- Real-time monitoring: Bokeh handles streaming data, so it fits IoT telemetry, trading screens, and live ops dashboards.
- Reproducible notebooks: Altair's declarative style keeps chart logic readable and version-control friendly.
- Self-serve exploration: PyGWalker lets analysts dig through a DataFrame without writing plotting code.
What This Means for Python Hiring
Knowing one charting library is not enough on a modern data team. The valuable skill is choosing the right tool for the output, static for reports, interactive for dashboards, and a full app when stakeholders need to click around. When you review a Python developer, ask how they would visualize the same dataset for a paper, a dashboard, and a live monitor. The answer shows whether they understand trade-offs or only know one default. For teams hiring, that judgment is a strong signal of someone who ships data products other people can actually use.
Conclusion
These Python libraries are all excellent choices for producing clear, insightful visualizations. Each has its own strengths, so you can match the tool to your data and your project. Matplotlib is widely trusted for everyday 2D plots, while Geoplotlib is built for geographic work and Dash turns analysis into a web app. Pick the library that fits the job, and use the comparison table above when you are unsure.
For Developers: Join Index.dev's talent network to showcase your skills and get matched with companies building high-performance systems. Index.dev accepts only the top 1% of 2.5 million applicants into a community of 30,000+ human-vetted engineers from LATAM and CEE.
For Companies: Need senior Python engineers who build fast, reliable data systems? Hire from Index.dev's network of 30,000+ human-vetted engineers from LATAM and CEE, matched in 48 hours. Teams save 40 to 60% on engineering costs, and 97% return for a second engagement.
