What is -Xmx in Java?
The -Xmx JVM option sets the maximum heap size for your Java application. It controls how much memory the JVM can allocate before throwing an OutOfMemoryError. Checking your Xmx value at runtime is essential for diagnosing memory issues, optimizing performance, and ensuring your application uses the right amount of heap space.
The quickest way to check Xmx at runtime:
java
long maxHeapBytes = Runtime.getRuntime().maxMemory();
System.out.println("Max Heap: " + (maxHeapBytes / 1024 / 1024) + " MB");
This guide covers multiple methods to check and monitor the -Xmx value, including Runtime.getRuntime().maxMemory(), command-line tools, and production-ready monitoring solutions.
Advance your Java career with top remote jobs at Index.dev. Join now to get matched with leading global companies!
What Is -Xmx? Java Max Heap Size Explained
The -Xmx flag is a JVM option that specifies the maximum heap size — the upper limit of memory the Java Virtual Machine can use for object allocation.
Syntax:
bash
java -Xmx<size> YourApplication
Examples:
bash
java -Xmx512m MyApp      # 512 megabytes
java -Xmx2g MyApp        # 2 gigabytes
java -Xmx4096m MyApp     # 4096 MB (4 GB)
Key points about -Xmx:
- m or M = megabytes, g or G = gigabytes, k or K = kilobytes
- -Xmx is equivalent to -XX:MaxHeapSize
- The value must be greater than 2 MB and a multiple of 1024 bytes
- Setting -Xmx too low causes OutOfMemoryError; too high causes long GC pauses
Default Xmx Values by Java Version
If you don't explicitly set -Xmx, the JVM calculates a default based on available system memory:
Java Version | Default -Xmx Calculation |
|---|---|
Java 8 | 1/4 of physical memory (max 32GB for server, 1GB for client) |
Java 11+ | 25% of physical memory (up to 25GB), min 16MB |
Java 17+ | Same as Java 11 |
Container (Docker/K8s) | Based on container memory limits, not host memory |
Check your default Xmx without running code:
bash
java -XX:+PrintFlagsFinal -version 2>&1 | grep MaxHeapSize
```

**Output example:**
```
size_t MaxHeapSize = 4294967296    # 4 GB in bytes
Important for Java 11 users: The default Xmx behavior changed in OpenJ9 0.20, where Java 8 now uses the same 25% calculation as Java 11.
By monitoring this value effectively, you can optimize your Java applications. If you're building Java-based microservices, see our guide to hiring Java developers for your team.
-Xmx Command: How to Set Max Heap Size
Here are common -Xmx command patterns for different scenarios:
Basic usage:
bash
# Set max heap to 1 GB
java -Xmx1g -jar myapp.jar

# Set max heap to 2048 MB
java -Xmx2048m -jar myapp.jar

# Set both initial (Xms) and max (Xmx) to same value (recommended for production)
java -Xms2g -Xmx2g -jar myapp.jar
For Spring Boot applications:
bash
java -Xmx1g -jar spring-boot-app.jar
In Docker/Kubernetes:
dockerfile
# Dockerfile
ENV JAVA_OPTS="-Xmx512m -Xms512m"
CMD ["sh", "-c", "java $JAVA_OPTS -jar app.jar"]
yaml
# Kubernetes deployment
env:
  - name: JAVA_OPTS
    value: "-Xmx1g -Xms1g"
For Gradle:
groovy
// build.gradle
applicationDefaultJvmArgs = ["-Xmx2g"]
For Maven:
bash
export MAVEN_OPTS="-Xmx1g"
mvn clean install
1. Runtime.getRuntime().maxMemory(): Check Xmx Programmatically
The Runtime.getRuntime().maxMemory() method returns the maximum amount of memory the JVM will attempt to use, in bytes. This corresponds to your -Xmx setting.
Basic usage:
java
public class CheckXmx {
    public static void main(String[] args) {
        Runtime runtime = Runtime.getRuntime();

        long maxMemory = runtime.maxMemory();      // -Xmx value
        long totalMemory = runtime.totalMemory();  // Currently allocated
        long freeMemory = runtime.freeMemory();    // Free within allocated

        System.out.println("Max Heap (-Xmx): " + toMB(maxMemory) + " MB");
        System.out.println("Total Allocated: " + toMB(totalMemory) + " MB");
        System.out.println("Free Memory: " + toMB(freeMemory) + " MB");
        System.out.println("Used Memory: " + toMB(totalMemory - freeMemory) + " MB");
    }

    private static long toMB(long bytes) {
        return bytes / (1024 * 1024);
    }
}
```

**Output when run with `-Xmx512m`:**
```
Max Heap (-Xmx): 512 MB
Total Allocated: 128 MB
Free Memory: 120 MB
Used Memory: 8 MB
Important notes:
- maxMemory() returns Long.MAX_VALUE if there's no inherent limit (rare)
- The value reflects the -Xmx setting, not actual physical memory
- In containers, this shows container limits when using container-aware JVM flags
2. Using ManagementFactory
For more detailed insights, we can use the ManagementFactory class:
import java.lang.management.ManagementFactory;
import java.lang.management.MemoryMXBean;
import java.lang.management.MemoryUsage;

public class DetailedHeapCheck {
    public static void main(String[] args) {
        MemoryMXBean memoryBean = ManagementFactory.getMemoryMXBean();
        MemoryUsage heapUsage = memoryBean.getHeapMemoryUsage();

        System.out.printf("Initial Heap: %d MB%n", heapUsage.getInit() / (1024 * 1024));
        System.out.printf("Used Heap: %d MB%n", heapUsage.getUsed() / (1024 * 1024));
        System.out.printf("Max Heap: %d MB%n", heapUsage.getMax() / (1024 * 1024));
        System.out.printf("Committed Heap: %d MB%n", heapUsage.getCommitted() / (1024 * 1024));
    }
}
This method provides a deeper look into heap memory usage beyond just -Xmx.
3. Checking JVM Flags with -XX:+PrintFlagsFinal
To check the -Xmx value without modifying code, use the following command:
java -XX:+PrintFlagsFinal -version | grep MaxHeapSize
Learn More: 4 Ways to Configure Environment Variables in Spring Boot
4. Using MemoryMXBean for Detailed Heap Information
For production monitoring, MemoryMXBean provides more detailed memory metrics:
java
import java.lang.management.ManagementFactory;
import java.lang.management.MemoryMXBean;
import java.lang.management.MemoryUsage;

public class DetailedHeapCheck {
    public static void main(String[] args) {
        MemoryMXBean memoryBean = ManagementFactory.getMemoryMXBean();
        MemoryUsage heapUsage = memoryBean.getHeapMemoryUsage();

        System.out.println("Initial Heap (-Xms): " + toMB(heapUsage.getInit()) + " MB");
        System.out.println("Used Heap: " + toMB(heapUsage.getUsed()) + " MB");
        System.out.println("Committed Heap: " + toMB(heapUsage.getCommitted()) + " MB");
        System.out.println("Max Heap (-Xmx): " + toMB(heapUsage.getMax()) + " MB");
    }

    private static long toMB(long bytes) {
        return bytes / (1024 * 1024);
    }
}
MemoryUsage fields explained:
Method | Description |
|---|---|
getInit() | Initial heap size (-Xms value) |
getUsed() | Currently used heap memory |
getCommitted() | Memory guaranteed to be available to JVM |
getMax() | Maximum heap size (-Xmx value) |
Benchmarking Different -Xmx Settings
Understanding the impact of different heap sizes is crucial. Here's a practical benchmarking approach:
import java.util.ArrayList;
import java.util.List;
import java.util.concurrent.TimeUnit;

public class HeapSizeBenchmark {
    private static final int ALLOCATION_SIZE_MB = 10;
    private static final int ITERATIONS = 100;

    public static void main(String[] args) {
        // Record starting time
        long startTime = System.nanoTime();
        List<BenchmarkResult> results = new ArrayList<>();

        try {
            // Perform memory-intensive operations
            List<byte[]> allocations = new ArrayList<>();
            for (int i = 0; i < ITERATIONS; i++) {
                // Allocate memory blocks
                allocations.add(new byte[ALLOCATION_SIZE_MB * 1024 * 1024]);

                // Record metrics
                Runtime runtime = Runtime.getRuntime();
                long usedMemory = runtime.totalMemory() - runtime.freeMemory();
                results.add(new BenchmarkResult(
                    i + 1,
                    usedMemory / (1024 * 1024),
                    System.nanoTime() - startTime
                ));

                // Clear some memory periodically
                if (i % 10 == 0) {
                    allocations.subList(0, allocations.size() / 2).clear();
                    System.gc();
                }
            }
        } finally {
            // Print results
            System.out.println("Benchmark Results:");
            System.out.println("Iteration\tMemory Used (MB)\tTime (ms)");
            for (BenchmarkResult result : results) {
                System.out.printf("%d\t\t%d\t\t%.2f%n",
                    result.iteration,
                    result.memoryUsedMB,
                    result.timeNanos / 1_000_000.0);
            }
        }
    }

    private static class BenchmarkResult {
        final int iteration;
        final long memoryUsedMB;
        final long timeNanos;

        BenchmarkResult(int iteration, long memoryUsedMB, long timeNanos) {
            this.iteration = iteration;
            this.memoryUsedMB = memoryUsedMB;
            this.timeNanos = timeNanos;
        }
    }
}
Run this benchmark with different -Xmx settings:
java -Xmx512m HeapSizeBenchmark
java -Xmx1g HeapSizeBenchmark
java -Xmx2g HeapSizeBenchmark
Here’s how changing -Xmx impacts performance:
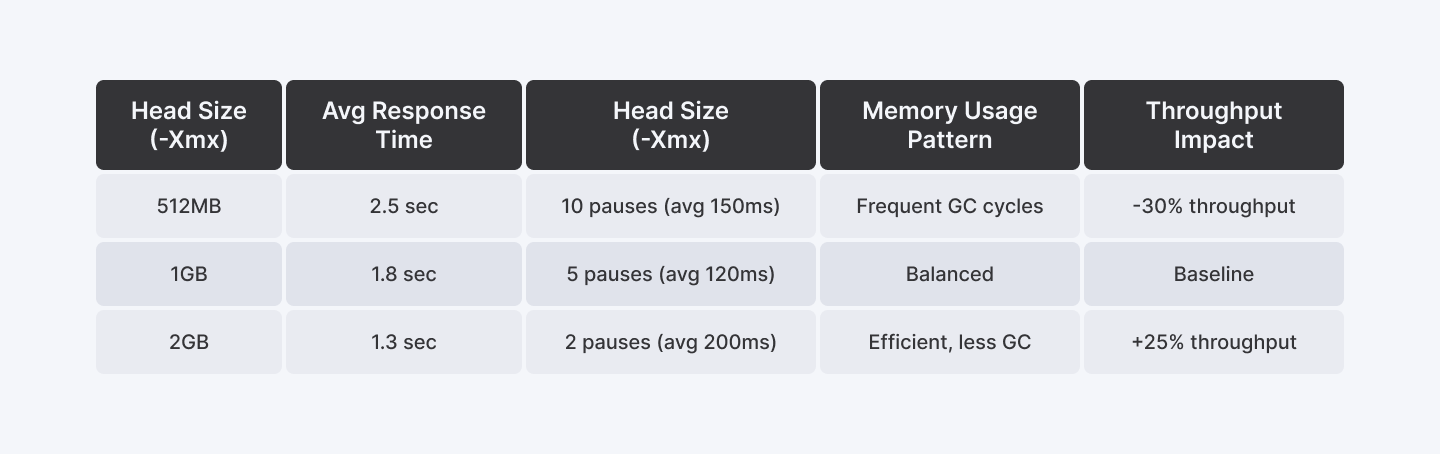
A higher -Xmx reduces garbage collection pauses, improving performance.
Use Case: Debugging Memory Issues
Imagine a Java-based microservices application running in a Kubernetes cluster. The DevOps team notices frequent OutOfMemoryErrors, but logs are unclear. By checking -Xmx at runtime, they realize the JVM is allocated only 512MB, while the pod has 2GB of available memory. Increasing -Xmx to 1.5GB resolves the issue, improving stability.
Advanced Memory Monitoring Tips
- Use JDK Flight Recorder (JFR)
java -XX:StartFlightRecording=duration=60s,filename=recording.jfr YourApp
- Enable GC Logging
java -Xlog:gc*=debug:file=gc.log YourApp
- Use JMX Monitoring
Configure JMX in your application to enable remote monitoring:
java -Dcom.sun.management.jmxremote YourApp
Advanced Debugging Techniques
- Using JVisualVM - Graphical monitoring for heap and GC behavior.
- Using GC Logs (-XX:+PrintGCDetails) - Provides detailed insights into memory usage.
- Using Heap Dumps (jmap -heap <pid>) - Helps analyze memory allocation trends.
Troubleshooting Common Issues
1. OutOfMemoryError Despite Sufficient -Xmx
Symptoms:
- Application crashes with OutOfMemoryError
- Memory usage grows steadily
- GC activity increases over time
Solutions:
- Generate heap dump: jmap -dump:format=b,file=heap.hprof <pid>`
- Analyze with Memory Analyzer Tool (MAT)
- Check for memory leaks using leak suspects report
- Review large object allocations
2. Excessive GC Pauses
Symptoms:
- Application response time spikes
- High CPU usage during GC
- Frequent Full GC events
Solutions:
- Enable GC logging: -Xlog:gc*=debug:file=gc.log
- Analyze GC log with tools like GCViewer
- Consider adjusting -XX:NewRatio and -XX:SurvivorRatio
- Review object lifetime patterns
3. Container Memory Issues
Symptoms:
- Container OOM kills
- JVM doesn't see correct memory limits
- Unexpected memory scaling behavior
Solutions:
- Use -XX:+UseContainerSupport
- Set -XX:MaxRAMPercentage instead of fixed -Xmx
- Monitor container memory metrics
- Review cgroup limits
TL;DR - Key Takeaways
Basic Implementation
- Use Runtime.getRuntime().maxMemory() for quick development checks
- Use ManagementFactory for detailed production monitoring
- Employ the HeapMonitor utility class for comprehensive production usage
- Benchmark your specific workload to find optimal -Xmx settings
Production Best Practices
1. Memory Configuration
- Set -Xmx based on container limits and application profiling
- Use -XX:MaxRAMPercentage in containerized environments
- Configure appropriate GC algorithm for your use case
2. Monitoring Setup
- Implement automated heap monitoring with alerting
- Set up JMX monitoring with security controls
- Use dedicated service accounts for monitoring access
- Configure regular heap dump cleanup
3. Security Measures
- Enable SSL for JMX connections
- Implement network-level isolation for monitoring ports
- Rotate monitoring credentials regularly
- Set up audit logging for monitoring access
4. Performance Optimization
- Regular GC log analysis
- Periodic heap dump analysis
- Memory leak detection monitoring
- Load testing with different memory configurations
5. Operational Readiness
- Document memory-related incident response procedures
- Maintain runbooks for common memory issues
- Set up automated scaling based on memory metrics
- Regular review and adjustment of memory thresholds
Before wrapping up, let’s take a moment to emphasize the importance of ongoing monitoring and adjustments. JVM behavior can change based on workload, so fine-tuning heap size isn't a one-time task but an ongoing process for optimal performance. For broader development team insights, explore our JavaScript developer hourly rates if you're building full-stack applications.
Explore More: How to Check If a Path is Valid in Java
Conclusion
Understanding and monitoring your Java -Xmx value is essential for application stability and performance. Here's a quick summary of the methods covered:
Quick checks:
- Runtime API: Runtime.getRuntime().maxMemory() — simple, works everywhere
- Command line: java -XX:+PrintFlagsFinal -version | grep MaxHeapSize
- MemoryMXBean: For detailed heap metrics in production
Best practices:
- Set -Xms and -Xmx to the same value in production
- For containers, ensure your JVM respects container memory limits
- Monitor heap usage continuously, not just at deployment
- Start conservative and increase based on actual memory profiling
Common Xmx values by application type:
- Small microservices: 256m - 512m
- Medium applications: 1g - 2g
- Large enterprise apps: 4g - 8g
- Data-intensive processing: 8g+
For more advanced memory management techniques, check out the JVM Troubleshooting Guide.
Need Java developers for your team? Hire pre-vetted Java engineers through Index.dev to build performant, well-tuned applications.
For Developers:
Want to refine your Java performance tuning skills? Explore in-depth tutorials and expert insights at Index.dev. Join us for access to career opportunities and hands-on learning resources.
For Companies:
Looking for experienced Java developers who excel in memory optimization and performance tuning? Index.dev connects you with pre-vetted tech talent within 48 hours - risk-free for 30 days. Start building high-performance applications with the right team today!
