We've all been there: staring at our code, wondering why it keeps failing in production when it worked perfectly on our machine. Many developers spend entire weekends tracking down bugs that turn out to be simple indexing errors. If only we'd known how to use PDB properly!
Debugging is at the heart of any software development process, and mastering Python script debugging is essential for writing robust code. In this Python debugger tutorial, we'll walk you through the Python Debugger (PDB) - from basic techniques to advanced methods picked up over years of wrestling with stubborn bugs.
For those who prefer official documentation, check out the Python Debugger (pdb) documentation and the breakpoint() function documentation.
Want to work on high-paying Python projects remotely? Join Index.dev and get matched with top global companies!
Introduction to PDB
PDB, the Python Debugger, has been around since Python's early days, and many developers still remember their first "aha!" moment with it. After years of littering code with print statements (come on, we've all done it), discovering PDB feels like trading in a bicycle for a sports car.
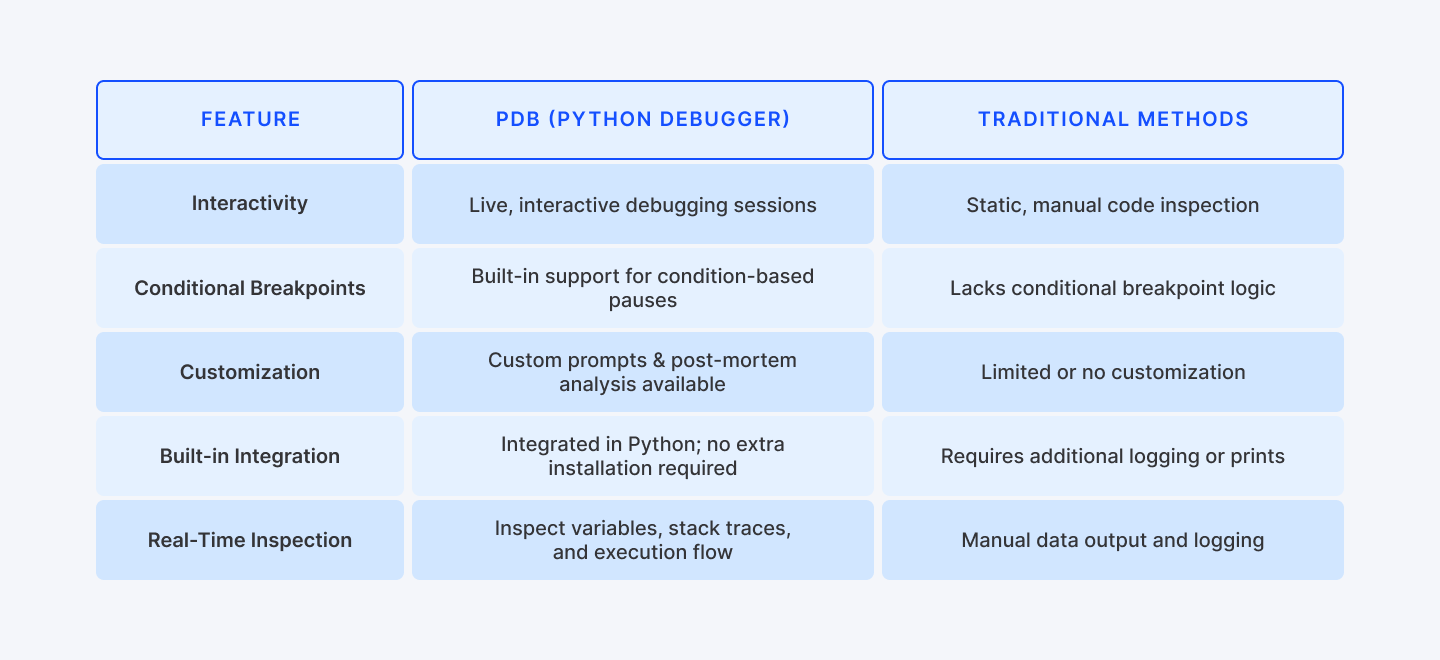
What makes PDB special is its ability to pause execution, inspect variables, and step through code line by line. Unlike those print statements we guiltily add and then forget to remove, PDB offers a more interactive and precise way to diagnose issues.
PDB works great with PyCharm and VSCode, and it scales surprisingly well from tiny scripts to massive, multi-threaded applications. Trust us, once you get comfortable with PDB, you'll wonder how you ever lived without it.
Understanding the Basics of Debugging
Before diving into the specifics of PDB, let's get our heads around some foundational concepts:
- Breakpoints: These are like stop signs you place in your code. When execution reaches a breakpoint, it pauses so you can look around.
- Stack Traces: These show you the path your program took to reach its current state - super helpful when you're lost in a maze of function calls.
- Execution Flow: This is the order in which your program runs. Sometimes it's not what you expect!
Debugging isn't just about fixing errors - it's about understanding your program's logic. When you use PDB commands Python offers, you're essentially getting X-ray vision into your program's inner workings.
Explore More: Best Ways to Get a File Suffix (Extension) in Python
Recent Improvements in Python Debugging Techniques
Python debugging has evolved significantly with recent versions. Python 3.12 and 3.13 introduced convenience variables for storing values during debugging sessions and performance optimizations that make PDB faster even with complex codebases. For enhanced debugging experiences, consider libraries like ipdb and pdb++ which add syntax highlighting and intuitive interfaces to standard PDB - especially valuable for Python script debugging modern asynchronous or multi-threaded applications.
Getting Started with PDB
Let’s start with the basics. To begin a debugging session, you typically insert a breakpoint in your code. In Python 3.7 and later, you can use the built-in breakpoint() function, which by default calls pdb.set_trace().
Basic Debugging Example
Below is an example that demonstrates how to step through a simple script using PDB:
# Example: Basic Python script debugging with PDB
def calculate_total(prices):
    """Calculate the sum of all prices in the list."""
    total = 0
    for i, price in enumerate(prices):
        # Adding price to total
        total += price
        # Set a breakpoint to inspect variables at each iteration
        if i == 1:  # Only break on the second iteration for efficiency
            breakpoint()  # Alternatively: import pdb; pdb.set_trace()
    return total

if __name__ == "__main__":
    item_prices = [19.99, 29.99, 4.99, 15.99]
    # Calculate total price with debugging enabled
    total_price = calculate_total(item_prices)
    print(f"Total Price: ${total_price:.2f}")
Explanation:
When we debug Python with PDB in this example, we're effectively debugging by incorporating a docstring and using enumerate() for added context. The breakpoint() pauses execution on the second iteration, letting you inspect variables like total and price interactively. Use commands such as next, step, and continue to navigate the code, while improved f-string formatting ensures a professional output.
This simple example provides the foundation for understanding PDB commands Python offers and how to integrate them into your debugging workflow.
Advanced Debugging Techniques Using PDB
For developers who need more than the basics, advanced techniques can take your Python script debugging skills to the next level. Here, we'll explore several powerful methods.
1. Conditional Breakpoints
Rather than stopping on every iteration, conditional breakpoints let you pause only when certain conditions are met. This is especially useful when you’re processing large datasets.
# Example: Using a conditional breakpoint in a loop
def find_anomalies(data, threshold=0):
    """Find and report anomalous values in a dataset."""
    anomalies = []
    for index, value in enumerate(data):
        # Trigger the debugger only when an anomaly is detected
        if value < threshold:
            breakpoint()  # Debug when value is below threshold
            anomalies.append((index, value))
    return anomalies

if __name__ == "__main__":
    sample_data = [10, 20, 30, -5, 40, -12, 50]
    found_anomalies = find_anomalies(sample_data)
    print(f"Found {len(found_anomalies)} anomalies:")
    for pos, val in found_anomalies:
        print(f"  Position {pos}: value {val}")
Explanation:
The power of this approach is its targeted nature, crucial for efficient Python script debugging in real-world applications. The debugger activates only when negative values are encountered, which is essential when working with large datasets. Rather than being overwhelmed by breakpoints, you focus precisely on the anomalous data points. This transforms debugging from mere troubleshooting to a data analysis tool, providing actionable insights while maintaining clean, well-documented code.
2. Custom Debugging Prompts and Post-Mortem Analysis
For situations where you need to differentiate between multiple debugging sessions, need specialized debugging context, want to analyze errors after they occur, or even attach to a running process, custom prompts, post-mortem analysis, and remote debugging techniques become invaluable.
# Example: Custom debugging session with a specialized prompt
import pdb

class CustomDebugger(pdb.Pdb):
    """Custom PDB debugger with enhanced prompts and capabilities."""
    def __init__(self, prompt_prefix="CustomDebug"):
        super().__init__()
        self.prompt = f"({prompt_prefix}) "

def debug_with_context(context_name=""):
    """Start a PDB session with contextual information."""
    # Create a custom debugger with a descriptive prompt
    custom_debugger = CustomDebugger(prompt_prefix=f"Debug-{context_name}")
    custom_debugger.set_trace()

def process_transaction(transaction, limit=100):
    """Process a financial transaction with validation."""
    result = 0

    # Validate transaction data
    if not isinstance(transaction, dict) or "amount" not in transaction:
        raise ValueError("Invalid transaction format")

    # Process the transaction
    amount = transaction["amount"]
    result += amount

    # If amount exceeds limit, trigger specialized debugging
    if amount > limit:
        print(f"Large transaction detected: ${amount}")
        debug_with_context(f"HighValue-{transaction.get('id', 'unknown')}")

    return result

if __name__ == "__main__":
    try:
        # Example transactions - one normal, one high-value
        transactions = [
            {"id": "T001", "amount": 75.50, "source": "online"},
            {"id": "T002", "amount": 150.25, "source": "in-store"}
        ]

        for tx in transactions:
            total = process_transaction(tx)
            print(f"Processed transaction {tx['id']}: ${total:.2f}")

    except Exception as e:
        # Post-mortem debugging when unexpected errors occur
        print(f"Error occurred: {e}")
        print("Starting post-mortem debugging...")
        pdb.post_mortem()
Explanation:
This enhanced example showcases advanced PDB commands Python offers:
This example illustrates advanced PDB commands in Python and debugging with a custom PDB class that sets a specialized prompt for clear context. It supports post-mortem analysis, enabling you to inspect the state after exceptions. The structured error handling demonstrates how to manage debugging sessions in complex or remote environments.
For remote debugging, consider libraries like rpdb or tools like remote-pdb, which extend PDB's functionality to allow debugging over network connections. This is critical in distributed systems or multi-container environments.
Debugging Multi-threaded Applications with PDB
Multi-threaded applications introduce additional complexity because threads can interfere with each other, leading to race conditions or deadlocks. PDB can be used in these scenarios, but it requires careful handling.
# Example: Debugging a multi-threaded application
import threading
import time
import pdb
import queue

class ThreadSafeCounter:
    """Thread-safe counter implementation with debugging capabilities."""
    def __init__(self, name="counter"):
        self.count = 0
        self.lock = threading.Lock()
        self.name = name
        self.debug_points = set()

    def increment(self, amount=1, debug_at=None):
        """Thread-safe method to increment the counter."""
        with self.lock:
            old_value = self.count
            # Simulate some processing time
            time.sleep(0.01)
            self.count += amount

            # Set debug point if the count matches a debugging condition
            if debug_at and self.count in debug_at and self.count not in self.debug_points:
                self.debug_points.add(self.count)
                print(f"Debug trigger in {self.name}: count = {self.count}")
                breakpoint()

            return self.count, old_value

def worker(counter, task_queue, worker_id):
    """Worker function that processes items from a queue."""
    while True:
        try:
            # Get the next task or timeout after 1 second
            task = task_queue.get(timeout=1)

            if task is None:  # Sentinel value to stop the thread
                print(f"Worker {worker_id} shutting down")
                break

            # Process the task (increment the counter)
            new_val, old_val = counter.increment(
                amount=task,
                debug_at={5, 10, 15}  # Debug at specific counter values
            )
            print(f"Worker {worker_id}: {old_val} → {new_val}")

            # Mark task as done
            task_queue.task_done()

        except queue.Empty:
            print(f"Worker {worker_id} timed out waiting for tasks")
            break

if __name__ == "__main__":
    # Create a shared counter and task queue
    shared_counter = ThreadSafeCounter("shared_counter")
    task_queue = queue.Queue()

    # Add tasks to the queue
    for i in range(20):
        task_queue.put(1)  # Each task increments by 1

    # Add sentinel values to signal threads to exit
    for _ in range(2):
        task_queue.put(None)

    # Create and start worker threads
    threads = []
    for i in range(2):
        thread = threading.Thread(
            target=worker,
            args=(shared_counter, task_queue, i+1)
        )
        thread.daemon = True
        threads.append(thread)
        thread.start()

    # Wait for all threads to complete
    for thread in threads:
        thread.join(timeout=5)

    print(f"Final counter value: {shared_counter.count}")
Explanation:
This multi-threaded example employs a thread-safe counter with mutex locks along with the targeted use of breakpoint() at specific counter values (e.g., 5, 10, 15) to diagnose synchronization issues. The approach pauses only the affected thread, facilitating effective inspection of thread-specific states without halting the entire application.
Handling Exceptions and Tracebacks
A major advantage of using PDB is its ability to help you handle exceptions more gracefully. PDB lets you set breakpoints on exceptions, inspect the call stack, and navigate through tracebacks for deeper insights.
# Example: Interactive exception debugging with PDB
def safe_division(numerator, denominator, fallback=None):
    """
    Perform division with comprehensive error handling and debugging.

    Args:
        numerator: Value to be divided
        denominator: Value to divide by
        fallback: Return value if division fails

    Returns:
        Result of division or fallback value
    """
    try:
        # Validate inputs before attempting division
        if not isinstance(numerator, (int, float)) or not isinstance(denominator, (int, float)):
            raise TypeError("Both inputs must be numeric values")

        result = numerator / denominator
        return result

    except ZeroDivisionError as e:
        # When division by zero occurs, enter debugging mode
        print(f"Cannot divide {numerator} by zero!")
        breakpoint()  # Debug Python with PDB to inspect the error state
        return fallback

    except TypeError as e:
        # For type errors, provide detailed diagnostics
        print(f"Type error: {e}")
        print(f"Received: numerator={type(numerator)}, denominator={type(denominator)}")
        breakpoint()  # Examine the problematic values
        return fallback

if __name__ == "__main__":
    # Test with various scenarios that trigger different exceptions
    test_cases = [
        (10, 2),           # Normal case
        (10, 0),           # Zero division
        ("10", 2),         # Type error
        (None, "invalid")  # Multiple type errors
    ]

    for num, denom in test_cases:
        print(f"\nAttempting: {num} / {denom}")
        result = safe_division(num, denom, fallback="ERROR")
        print(f"Result: {result}")
Explanation:
This example triggers the debugger upon exceptions, allowing you to inspect the program’s state at the critical moment of failure. It manages multiple exception types with detailed error reporting, transforming errors into interactive debugging opportunities that help pinpoint issues more efficiently. Here, when the debugger activates, you can use PDB commands Python offers like where or bt to examine the call stack, p locals() to inspect all local variables, and even modify variables to test potential fixes.
Many financial calculation modules experience subtle numerical errors with certain inputs. Using this exception-triggered debugging approach allows you to catch these cases in real-time and understand exactly what's happening.
Best Practices for Using PDB
To ensure that your debugging sessions remain efficient and your code stays clean, consider these best practices:
1. Master Essential PDB Commands
Familiarize yourself with core PDB commands Python provides:
- h or help: View available commands
- n or next: Execute the current line and move to the next one
- s or step: Step into a function call
- c or continue: Continue execution until the next breakpoint
- where to inspect the current call stack
- q or quit: Exit the debugger and terminate the program
- p <expression>: Print the value of an expression
- l or list: Show the current position in the code/view code context
Most developers use n most frequently, followed by p. Your preferences may vary depending on your debugging style.
2. Organize Debugging Sessions
Use conditional breakpoints and custom prompts to keep your debugging sessions focused. Place breakpoints at critical decision points in your code
3. Remove Debug Statements Post-Debugging
Ensure that you remove or comment out debugging lines (like breakpoint()) before deploying your code to production to prevent performance overhead.
4. Leverage Advanced Techniques
- Use pdb.pm() for post-mortem debugging after exceptions
- Set custom prompts for context-aware debugging sessions
- Implement thread-safe debugging for concurrent applications
5. Combine with Other Tools
- Use logging alongside PDB for permanent debugging records
- Consider enhanced debuggers like ipdb or pdb++ for additional features
- Integrate with IDE debugging tools when available
6. Document Your Debug Sessions
Keep notes on the issues encountered and the steps taken to resolve them. This helps in building a knowledge base for future debugging challenges.
7. Stay Updated
Regularly review the latest Python Debugger documentation to learn about new features and enhancements that can improve your debugging workflow.
By following these practices, you can ensure that your use of PDB is both powerful and sustainable over the long term.
Real-World Use Cases and Case Studies
Consider a data processing pipeline aggregating financial data from multiple sources. When discrepancies appear in the results, strategic debugging with PDB can quickly isolate the issue:
- By inserting a conditional breakpoint in the data transformation function, you can pause execution exactly when a record's transformation doesn't match expected patterns.
- When unexpected data formats trigger exceptions, real-time debugging lets you examine the exact record causing the issue and implement appropriate error handling.
- For multi-threaded pipelines, thread-specific breakpoints help diagnose race conditions without disrupting the entire process.
This targeted approach in Python script debugging can transform bugs that might take days to find with print statements into problems solvable in minutes - dramatically reducing downtime and improving application reliability.
Learn More: How to Generate Realistic Data for Machine Learning using Python
Conclusion
Learning to debug effectively with PDB is truly a game-changer. Many developers report that transitioning from print-based debugging to interactive debugging is eye-opening—suddenly, bugs that took days to track down become solvable in minutes.
In this Python debugger tutorial, we've covered everything from the basics of setting a breakpoint using breakpoint() or pdb.set_trace(), to advance multi-threaded debugging. All of them form a toolkit that will serve you well throughout your Python career. As your debugging skills grow, you'll spend less time fixing bugs and more time building cool features.
What debugging trick has saved you the most time? We'd love to hear about your experiences on our socials!
For Developers:
Boost your Python skills and land high-paying remote jobs! Explore advanced tutorials at Index.dev, from debugging to async patterns. Join top global companies and get matched with exciting projects—no job-hunting hassle, just great opportunities!
For Clients:
If you're looking for Python developers who can write clean, maintainable code and debug effectively, Index.dev connects you with pre-vetted talent. Our talent network helps you find developers who understand these modern debugging patterns, with a risk-free 30-day trial.
