As Python applications grow in complexity, efficient memory management becomes critical. Memory errors – ranging from MemoryError exceptions to elusive memory leaks – can lead to application crashes, degraded performance, or increased operational costs. In this article, we’ll explore methods to fix memory errors Python, prevent memory leaks Python, optimize memory usage Python, and handle MemoryError Python exceptions. We dive deep into both foundational techniques and advanced strategies, explaining every step and decision along the way.
Join top global companies and work on high-paying remote jobs that fit your skills. Get hired faster with zero job-hunting stress!
Understanding Memory Errors in Python
Definition of Memory Errors
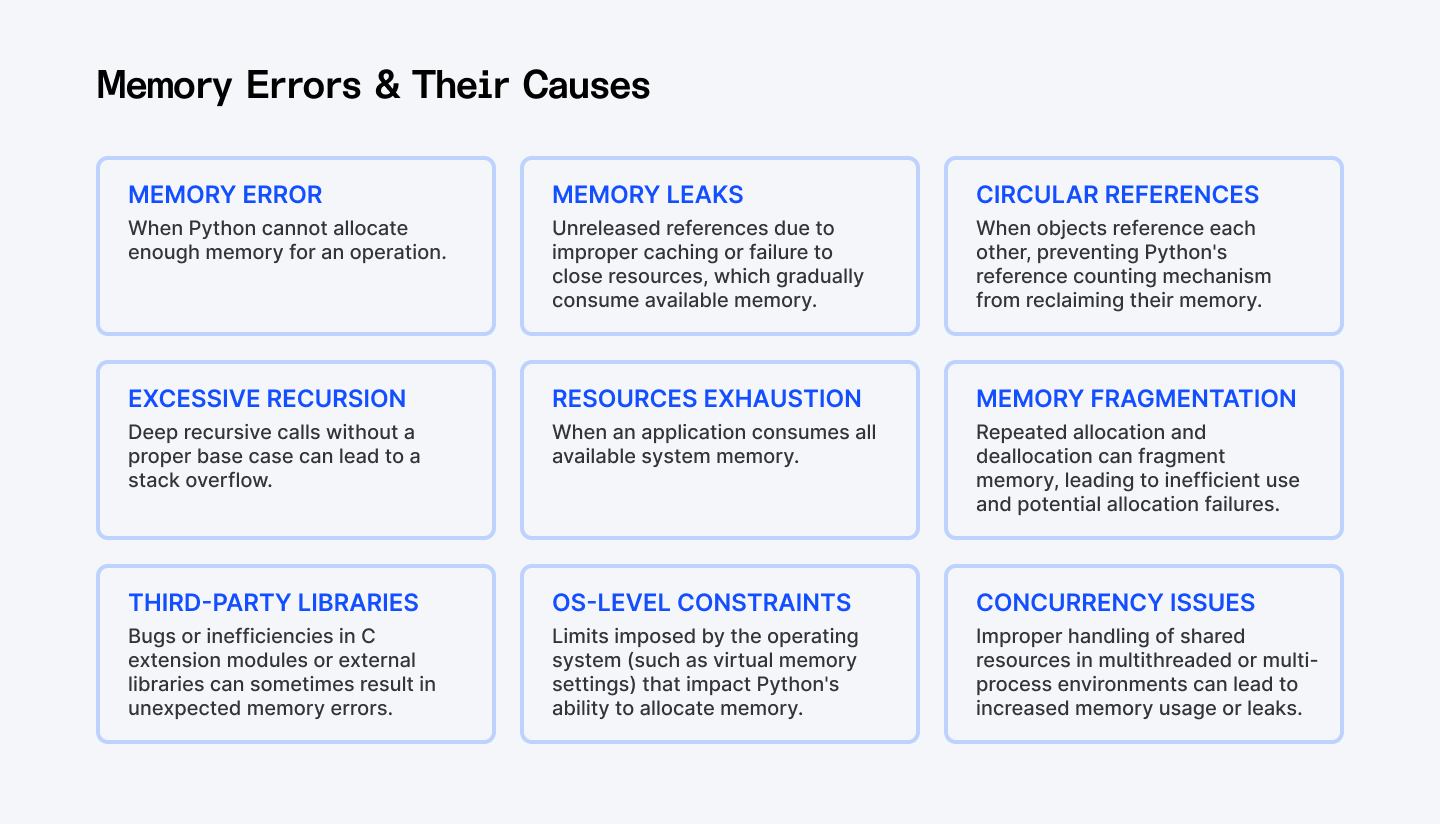
A MemoryError occurs when Python cannot allocate enough memory for an operation. This can happen in scenarios such as:
- Insufficient Memory Allocation: When processing huge datasets or creating massive data structures.
- Memory Leaks: When objects remain referenced long after they’re needed.
- Circular References: When two or more objects reference each other, hindering garbage collection.
- Segmentation Faults: Although less common in pure Python, these can arise when interfacing with lower-level libraries.
- Resource Exhaustion: When your application consumes all available system memory.
For further details, refer to the MemoryError documentation on Python.org.
Common Causes of Memory Errors
Memory errors generally result from:
- Large Data Structures: Inefficient handling of data by using memory-intensive collections such as oversized lists or dictionaries.
- Memory Leaks: Unreleased references due to improper caching or circular dependencies such as failing to close files, network connections, or database cursors.
- Circular References: These block Python’s garbage collection from reclaiming memory.
- Excessive Recursion: Deep recursive calls without a proper base case may lead to stack overflows.
- Hidden References: Keeping references in function closures, caches, or global variables.
Understanding these issues is the first step toward learning how to fix memory errors Python and prevent memory leaks Python.
Also Check Out: How to Check If a Set Is Mutually Exclusive in Python
Optimization Strategies
Optimizing memory starts with choosing the right data structures and using powerful profiling tools. Let’s examine some effective strategies and the rationale behind each code approach.
Using Efficient Data Structures
Selecting the appropriate data structure is key to optimizing memory usage Python. Here’s how we can leverage generators to avoid the overhead of loading large datasets into memory:
Example: Using Generators Instead of Lists
import sys

def compare_memory_usage():
    # Create a large list (memory-intensive)
    large_list = [i for i in range(10**6)]

    # Create a generator (memory-efficient)
    large_generator = (i for i in range(10**6))

    # Compare memory usage
    list_memory = sys.getsizeof(large_list)
    generator_memory = sys.getsizeof(large_generator)

    print(f"Memory usage of list: {list_memory:,} bytes")
    print(f"Memory usage of generator: {generator_memory:,} bytes")
    print(f"Memory efficiency: {list_memory / generator_memory:.1f}x improvement")

    # Process data without loading everything into memory
    def process_item(item):
        return item * 2

    # Using generators prevents memory leaks in Python data processing
    processed = (process_item(item) for item in large_generator)
    print(f"First processed item: {next(processed)}")
Explanation:
This code demonstrates a fundamental memory optimization technique – using generators for lazy evaluation.
Why this works: Generators produce values on-demand rather than storing all values in memory at once. By avoiding the storage of all numbers at once, we greatly reduce the memory footprint, thus helping to optimize memory usage Python and prevent potential MemoryError issues. The generator creates values one at a time as you request them, then discards them when you're done. This is particularly valuable when processing large files, API responses, or database results where only one item needs to be in memory at a time.
Memory Profiling Tools
Before we fix memory errors Python, it’s important to identify where your memory is being consumed. This is called profiling. Let’s look at two powerful tools: tracemalloc and memory_profiler.
1. Using tracemalloc for Profiling
import tracemalloc

def profile_memory():
    # Start tracking memory allocations
    tracemalloc.start()

    # Perform memory-intensive operation
    data = [x ** 2 for x in range(10**6)]

    # Get current and peak memory usage
    current, peak = tracemalloc.get_traced_memory()

    # Print results in megabytes
    print(f"Current memory: {current / 10**6:.2f} MB")
    print(f"Peak memory: {peak / 10**6:.2f} MB")

    # Stop tracking to free resources
    tracemalloc.stop()

if __name__ == '__main__':
    profile_memory()
Explanation:
This code uses Python's built-in tracemalloc module to track memory allocations. The key insight is that we first start memory tracking, perform our operations, measure usage, then stop tracking. This process helps us identify memory-intensive sections and enables us to fix memory errors Python by optimizing those parts. This gives us crucial information about memory consumption patterns that help us identify where to optimize memory usage Python applications.
2. Using memory_profiler for Detailed Analysis
# Install with: pip install memory_profiler
from memory_profiler import profile

@profile
def analyze_text_memory_usage(filepath):
    # Reading file (memory-intensive)
    with open(filepath, 'r') as f:
        content = f.read()

    # Count words (moderate memory usage)
    word_counts = {}
    for word in content.split():
        word = word.lower().strip('.,!?;:()[]{}""\'')
        if word:
            word_counts[word] = word_counts.get(word, 0) + 1

    # Get top words (minimal memory impact)
    top_words = sorted(word_counts.items(), key=lambda x: x[1], reverse=True)[:10]

    # Explicit cleanup to prevent memory leaks in Python
    del content
    del word_counts

    return top_words

# Run with: python -m memory_profiler script.py
Explanation:
This example demonstrates how to use the memory_profiler to identify memory bottlenecks in text processing. The code follows a common text analysis workflow:
- When you're processing text, the most memory-intensive operation is usually reading the entire file
- Building the word frequency dictionary adds moderate memory overhead
- Sorting to find top words has minimal memory impact
- We explicitly delete large objects when we're done with them
The @profile decorator is the key component - it provides line-by-line memory attribution, showing exactly which operations are memory-intensive. This information is crucial for optimizing memory usage in data processing pipelines. The explicit cleanup with del helps reclaim memory earlier, though Python's garbage collector would eventually free these objects when they go out of scope.
Optimize Object Lifespan Management
Managing how long objects live in memory is critical. Let’s see how we can explicitly release resources when they’re no longer needed.
1. Manual Reference Management
def process_large_data():
    # Create memory-intensive object
    data = [x ** 2 for x in range(10**6)]

    # Process the data
    result = sum(data) / len(data)

    # Explicitly release memory
    del data

    return result
Explanation:
By explicitly calling del data, we remove the reference to our large list earlier than Python's garbage collector might otherwise collect it, helping to prevent memory leaks Python. This helps optimize memory usage Python by freeing resources as soon as they're no longer needed.
2. Using Weak References
import weakref

class Node:
    def __init__(self, name):
        self.name = name
        self.neighbors = []

    def __del__(self):
        print(f"Node {self.name} has been destroyed")

def prevent_memory_leaks():
    # Create objects
    node_a = Node("A")
    node_b = Node("B")

    # Create regular reference (prevents garbage collection)
    node_a.neighbors.append(node_b)

    # Create weak reference (doesn't prevent garbage collection)
    node_b.neighbors.append(weakref.proxy(node_a))

    # Remove original reference to node_a
    del node_a

    # Force garbage collection
    import gc
    gc.collect()
Explanation:
This code demonstrates how to use weak references to prevent memory leaks caused by circular references. When you have circular references, Python's reference counting can't automatically clean up objects. When two objects reference each other strongly, neither can be garbage collected even if there are no external references to them. By making one of the references a weak reference (using weakref.proxy()), we break this cycle, allowing Python's garbage collector to clean up objects when they're no longer needed elsewhere in the program. This technique is particularly valuable in data structures with bidirectional relationships, event handlers, caching systems, and parent-child hierarchies.
Handling Large Data and Processing Strategies
When working with large datasets, you must process data in chunks or use external libraries designed for scalability.

This flowchart outlines the steps involved in processing large CSV files using a chunked approach. It guides you through the process - from reading data in manageable chunks to filtering, aggregating, and finally combining and outputting the results.
Chunked Processing Example
import pandas as pd

def process_large_csv(file_path, output_path, chunk_size=10000):
    # Initialize tracking variables
    total_rows = 0
    sum_values = 0
    filtered_rows = []

    # Process file in chunks to handle MemoryError Python exceptions
    for chunk in pd.read_csv(file_path, chunksize=chunk_size):
        # Update counts
        chunk_rows = len(chunk)
        total_rows += chunk_rows

        # Process this chunk
        if 'value' in chunk.columns:
            sum_values += chunk['value'].sum()

            # Keep only important data
            filtered = chunk[chunk['value'] > 100][['id', 'value']]
            if not filtered.empty:
                filtered_rows.append(filtered)

        print(f"Processed {total_rows} rows so far...")

    # Combine results (only if we found matching rows)
    if filtered_rows:
        result = pd.concat(filtered_rows, ignore_index=True)
        result.to_csv(output_path, index=False)

    print(f"Finished processing {total_rows} total rows")
    print(f"Sum of values: {sum_values}")
Explanation:
This approach reads and processes the file in manageable chunks rather than loading everything at once. We maintain running totals and only keep the filtered rows that match our criteria. This approach is critical for processing files that would otherwise cause MemoryError exceptions. The memory efficiency comes from:
- Never loading the entire file at once
- Processing each chunk independently
- Discarding irrelevant data early in the pipeline
- Optimizing intermediate storage by selecting only necessary columns
For large-scale data processing, this incremental approach can make the difference between success and failure, especially on machines with limited memory by helping you fix memory errors Python and handle MemoryError Python.
External Libraries (Dask)
For truly large datasets, consider using libraries designed for big data processing:
import pandas as pd
import dask.dataframe as dd

def compare_processing_approaches(file_path):
    print(f"Analyzing {file_path}")

    # Approach 1: Standard Pandas (might cause MemoryError)
    try:
        print("\nTrying with standard Pandas:")
        df = pd.read_csv(file_path)
        result1 = df.groupby('category')['value'].mean()
        print(f"Processed {len(df)} rows with Pandas")
    except MemoryError:
        print("MemoryError: Pandas couldn't fit the data in memory")

    # Approach 2: Dask (designed to handle large datasets)
    print("\nTrying with Dask:")
    ddf = dd.read_csv(file_path)
    result2 = ddf.groupby('category')['value'].mean().compute()
    print(f"Processed with Dask successfully")

    return result2
Explanation:
Dask provides parallel computing capabilities and breaks large datasets into smaller chunks that fit in memory. The operations are defined lazily and only executed when you call .compute(). This approach helps you handle MemoryError Python by distributing work across your CPU cores and processing data in manageable pieces.
Garbage Collection in Python
Python uses two memory management mechanisms, one is Reference counting where objects are deleted when their reference count reaches zero. The other is Garbage collection.
Understanding and fine-tuning garbage collection can make a significant difference in memory management.
Understanding Garbage Collection
Python uses reference counting as its primary memory management technique. However, to handle circular references, it also employs cyclic garbage collection. Python 3.9+ has seen improvements that further enhance this process. Detailed information is available in the official gc module documentation.
Garbage Collection Behavior Demonstration
import gc

def examine_garbage_collection():
    # Get current collection counts (objects waiting for collection)
    print("Current collection counts:")
    print(gc.get_count())

    # Create circular reference
    class CircularRef:
        def __init__(self):
            self.ref = None

    obj1 = CircularRef()
    obj2 = CircularRef()
    obj1.ref = obj2
    obj2.ref = obj1

    # These objects won't be collected automatically due to circular references
    obj1 = obj2 = None

    # Manually trigger collection to prevent memory leaks in Python
    collected = gc.collect()
    print(f"Collected {collected} objects")
Explanation:
This code demonstrates how circular references can prevent automatic garbage collection. Understanding this behavior helps developers to fix memory errors Python more proactively:
- Recognize when circular references might cause memory leaks
- Know when to manually trigger collection with gc.collect()
- Understand the performance implications of garbage collection
- Make better decisions about object lifecycle management
This technique is valuable when you need to optimize memory usage Python applications with complex object relationships.
Best Practices for Preventing Memory Errors
Adopting best practices is just as important as writing optimized code.
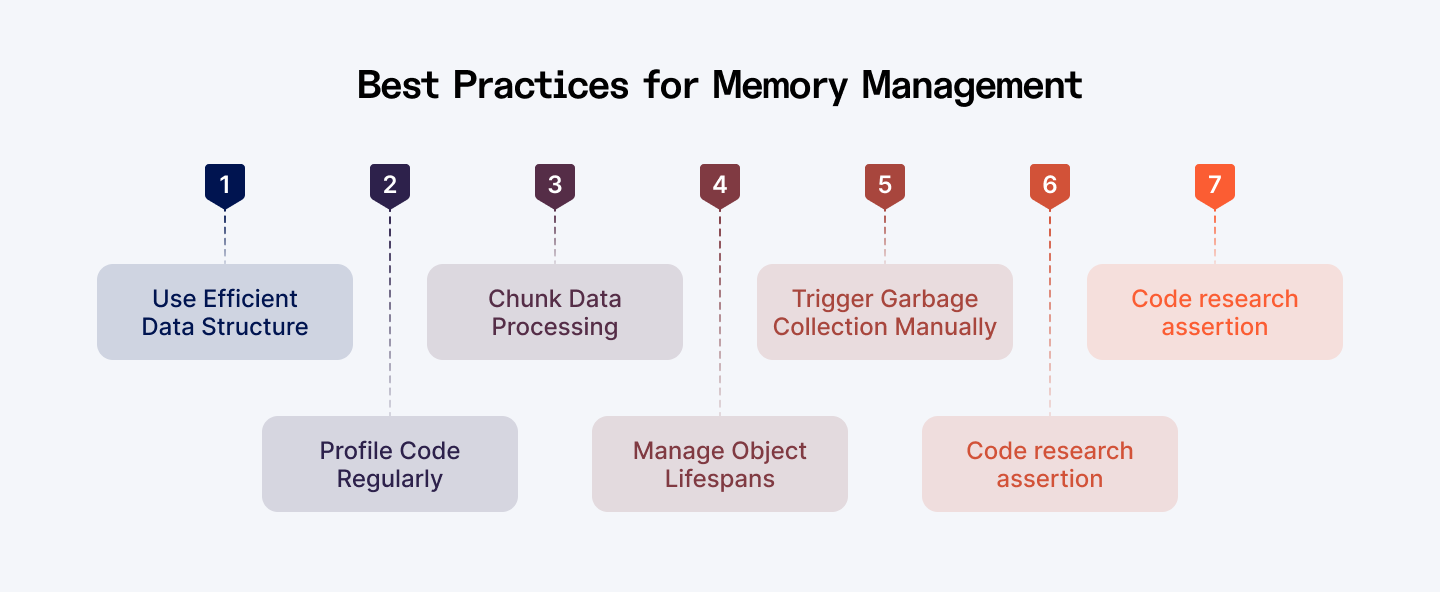
This infographic summarizes best practices for optimizing memory usage in Python.
Code Review and Refactoring
- Regular Reviews: Conduct periodic code reviews to catch inefficient data structures and lingering references.
- Choose efficient data structures like generators and iterators when working with large datasets.
- Profile your code to identify memory hotspots using tools like tracemalloc and memory_profiler
- Process large data in chunks to avoid loading everything into memory at once.
- Manage object lifecycles by explicitly deleting references and using weak references.
- Understand garbage collection and when to trigger it manually.
- Use memory-saving features like __slots__ and context managers.
Continuous Monitoring and Alerts
- Monitoring Tools: Implement tools that continuously monitor memory usage in production.
- Alerts: Set up alerts for unusual memory spikes, enabling quick responses before issues escalate.
Education and Documentation
- Team Training: Keep your team updated on the latest memory management best practices.
- Document Patterns: Maintain documentation on effective strategies to prevent memory leaks Python and fix memory errors Python, ensuring that everyone follows consistent coding standards.
Explore More: How to Simulate Realistic Data in Python for Machine Learning
Conclusion
Efficient memory management is essential for building robust and scalable Python applications. Here’s what we covered:
- Understanding Memory Errors: We defined key memory issues - from MemoryError to circular references - and discussed their root causes.
- Optimization Strategies: We explored the use of generators, detailed profiling with tools like tracemalloc and memory_profiler, and efficient object lifespan management through manual reference handling and weak references.
- Handling Large Data: Techniques such as chunking data and parallel processing with Dask provide practical solutions to handle big datasets.
- Garbage Collection Tuning: Manually triggering garbage collection can reclaim memory more efficiently in critical scenarios.
- Best Practices: Regular code reviews, continuous monitoring, and thorough documentation help maintain high code quality and prevent memory-related issues.
By applying these practices, you'll be better equipped to fix memory errors Python, prevent memory leaks Python, optimize memory usage, and handle MemoryError Python in your applications.
Remember that memory management is an ongoing process. As your application evolves, regularly revisit your code to ensure it remains memory-efficient. With these techniques in your toolkit, you'll be able to build and optimize memory usage Python applications that scale effectively even with large datasets and complex processing requirements.
For Developers:
Take your Python development skills to the next level. Join top global companies and work on innovative remote projects. Index.dev matches you with high-paying jobs that fit your skills. Get hired faster with zero job-hunting stress!
For Clients:
Are you seeking Python developers who excel at optimizing memory usage and preventing memory errors? Hire expert Python developers in just 48 hours. Index.dev connects you with pre-vetted, elite engineers who deliver results fast. Try our 30-day risk-free trial today!
