Engineering capacity decides how fast teams build, test, and ship products. It also affects code quality, release stability, and team performance. When teams manage capacity well, they deliver faster and avoid delays. When capacity is low or poorly managed, delivery slows down, and defects increase.
This data study combines insights from DORA, GitHub, McKinsey, IDC, Stack Overflow, and large-scale pull request datasets. It explains how engineering capacity affects delivery speed, code quality, and business outcomes using real data. All sources used in this study are listed below.
Scale your engineering capacity now with Index.dev →
Engineering Capacity: Key Stats That Define Performance
- High-performing teams complete code changes up to 127 times faster, showing how large the delivery gap is between teams
- Top teams release updates nearly 8 times more often, which helps them ship features continuously
- Change failure rates stay below 1% in strong teams, ensuring stable and reliable releases
- Elite teams recover from failures over 2,000 times faster, reducing downtime and impact on users
- High-capacity teams complete the full development cycle in under 25 hours, enabling faster time to market
- AI tools improve coding speed by 35% to 50%, reducing time spent on routine development work
- Teams using AI report up to 76% productivity gains, showing a clear impact on output
- Developers spend only 32% of their time on actual coding, with the rest going to meetings and coordination
- Interruptions reduce productivity by 20% to 60%, slowing down delivery and increasing delays
- The global tech talent shortage may exceed 1.2 million roles by 2026, directly affecting engineering capacity
How Engineering Capacity Impacts Delivery Speed and Quality
Engineering capacity directly affects how fast teams build and release products and how stable those releases are. Teams with higher capacity complete work faster, review code quickly, and deploy more often with fewer failures. Strong capacity also helps teams reduce rework and maintain consistent delivery quality.
Key data:
- High-performing teams complete code changes up to 127 times faster, which shows a massive gap in delivery speed
- Top teams release updates nearly 8 times more often, helping them ship features continuously
- Strong teams keep failure rates extremely low, with up to 182 times fewer failures than low-performing teams
- Recovery speed improves sharply, as top teams fix failed deployments over 2,000 times faster
- Elite teams complete the full development cycle in under 25 hours, while slower teams take more than 161 hours
- Coding work in high capacity teams takes less than 54 minutes, which reduces overall delivery time
- Code pickup time stays within 1 hour, which means developers start work quickly without delays
- Code reviews finish within 3 hours in efficient teams, helping faster approvals and releases
- Deployment processes complete in under 16 hours, enabling quicker product releases
- High capacity teams merge more than 2 pull requests per developer each week, increasing delivery output
- Deployment frequency goes beyond 1.2 releases per service, showing continuous delivery capability
- Change failure rates stay below 1%, which ensures stable and reliable releases
- Rework remains under 3%, meaning teams rarely need to redo recent work
- Refactoring stays below 11%, which shows controlled technical improvements without slowing delivery
What this means: Teams with strong capacity do not just move faster. They shorten the entire delivery cycle from coding to release. This helps them ship continuously, reduce waiting time, and keep releases stable even at high speed.
What Separates High-Capacity Teams from Low-Capacity Teams
High capacity teams operate very differently from low capacity teams. They follow better processes, maintain strong code quality, and deliver consistently. Low capacity teams struggle with delays, unstable releases, and poor output. The gap between these teams is not small. It is massive across every delivery metric.
Key data:
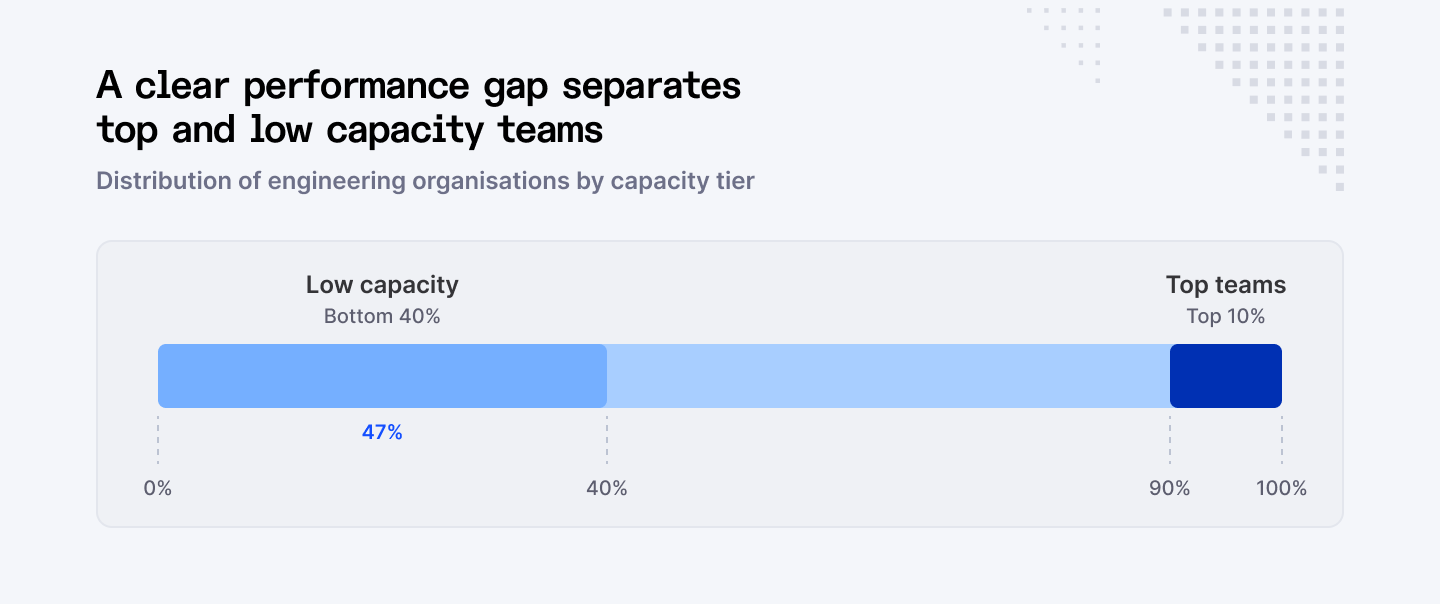
- Top teams fall within the top 10% of organizations, while low capacity teams sit in the bottom 40%, showing a clear performance gap
- High performing teams achieve deployment rates that are over 200 times higher when they follow strong engineering practices
- Recovery from system failures becomes over 100 times faster in teams that track and improve delivery metrics
- Leading teams are 2 times more likely to meet or exceed their business and delivery goals
- Elite teams maintain pull request acceptance rates above 95%, showing high code quality and readiness
- Even with AI usage, strong teams achieve over 70% acceptance rates, while most teams struggle to cross 60%
What this means: The gap between high and low capacity teams is not small. It creates a clear divide in output, reliability, and goal achievement. Strong teams operate at a different level, not just a slightly better one.
How Workflow Efficiency Affects Product Delivery
Workflow efficiency decides how smoothly code moves from development to production. When teams manage pull requests well, they reduce delays, improve review speed, and increase merge success. Poor workflow creates bottlenecks, slows delivery, and lowers output.
Key data:
- This analysis covers over 8.1 million pull requests across 4,800+ teams and 160,000+ developers, showing large-scale workflow patterns
- AI-assisted pull requests are around 2.6 times larger, which increases review complexity
- Advanced AI generated pull requests reach about 293 lines, compared to 157 lines in manual work
- At higher ranges, AI pull requests go up to 400+ lines, making reviews more time-consuming
- AI-driven pull requests stay idle for around 1,055 minutes, while manual ones wait only about 200 minutes
- AI-assisted pull requests take about 496 minutes to get picked up for review, showing delays before review even starts
- Once picked up, AI pull requests can be reviewed in about 194 minutes compared to 252 minutes for manual ones, showing faster review in simpler cases
- However, in complex cases, AI pull requests can take up to 382 minutes to review, which slows down delivery
- Manual pull requests get merged at a high rate of around 84%, while AI generated ones drop to nearly 33%
- High maturity teams merge around 2.25 pull requests per developer per week, while low maturity teams stay below 0.75
- Efficient teams complete approval within 15 hours, while slower teams take over 45 hours
What this means: Delivery speed depends heavily on how smoothly work moves through the system. Even small delays in review or approval create large slowdowns. Efficient workflows remove these bottlenecks and keep work flowing without breaks.
Does AI Increase Engineering Capacity and Delivery Speed
AI tools help teams write code faster and improve productivity, but they also introduce new challenges in review and acceptance. AI can increase capacity when used correctly, but it does not always guarantee faster delivery.
Key data:
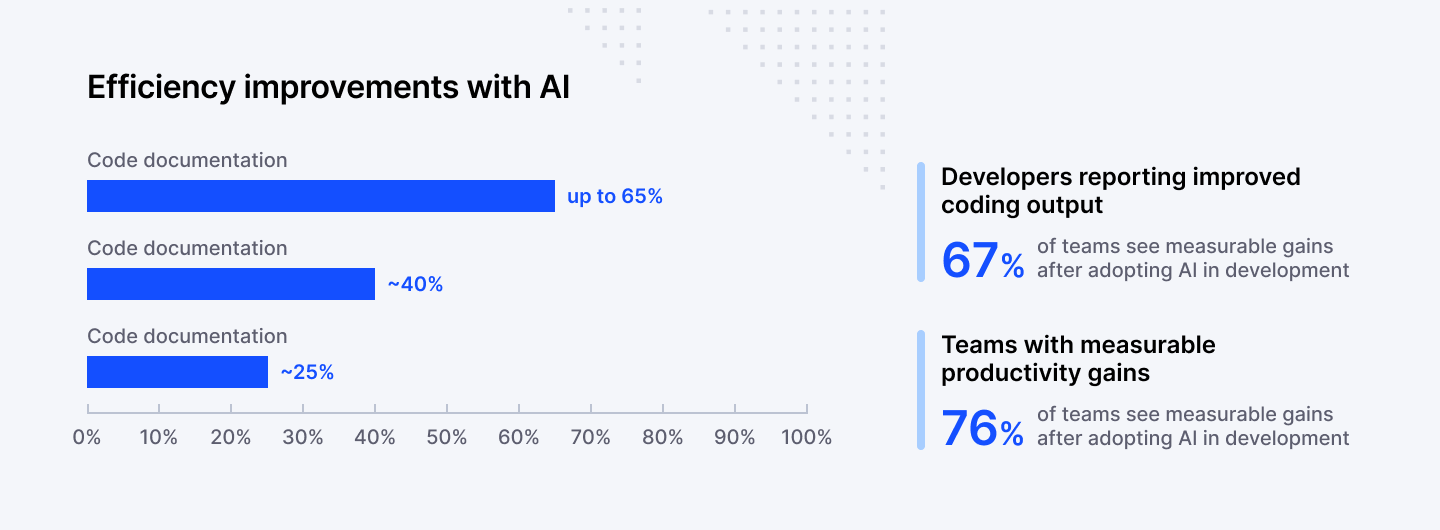
- Around 67% of developers report that AI tools help them improve their coding output
- Nearly 76% of teams see measurable productivity gains after adopting AI in development
- Debugging effort drops by nearly 25%, helping teams fix issues faster
- Code review efficiency improves by close to 40%, enabling quicker feedback cycles
- AI enabled teams improve coding time efficiency by up to 65% compared to traditional workflows
- Code review speed improves by nearly 50%, and top AI users achieve up to 70% faster reviews
- Bug detection improves by around 25%, with top teams reaching nearly 40% better detection rates
- AI tools speed up routine coding tasks by about 35% to 50%, reducing development time
- About 44% of teams still do not measure AI impact, so they cannot optimize usage or fully benefit from AI adoption.
What this means: AI increases coding speed, but it also adds review complexity. Teams that balance speed with control gain real benefits. Teams that ignore review quality may slow down despite using AI.
⭢ Discover how AI-assisted development is changing software delivery from the ground up.
What Factors Reduce Engineering Capacity
Many teams lose engineering capacity due to interruptions, poor focus, and constant task switching. These issues slow down development and reduce overall output. When teams protect focus time and reduce distractions, they deliver faster and with better quality.
Key data:
- Teams that avoid interruptions and maintain 4+ hours of focused work deliver around 47% more features and complete projects faster overall.
- Developers spend only about 32% of their time actually writing code, while the rest goes to meetings and other tasks
- Organizations can remove 30% to 50% of meetings without affecting productivity
- About 78% of developers say interruptions are their biggest productivity blocker
- Frequent context switching reduces productivity by 20% to 60%, depending on how often it happens
- Developers who switch tasks 4 to 5 times a day lose nearly 40% of their productive time
What this means: Capacity loss does not come from lack of effort. It comes from interruptions and scattered focus. Teams that protect deep work time unlock more output without adding more people.
How Should Teams Manage Engineering Capacity
Teams must plan capacity carefully to maintain steady delivery and avoid burnout. When teams balance workload, track capacity, and plan work properly, they improve both speed and quality. Poor capacity management leads to delays, missed deadlines, and team fatigue.
Key data:
- High-performing teams operate at around 70% to 80% utilization, which supports steady delivery without overload
- Productivity drops when teams exceed 85% to 90% utilization, as burnout and errors increase
- About 65% of engineering managers report experiencing burnout due to workload pressure
- Top teams achieve over 80% capacity accuracy, which means they plan work realistically
- Teams that follow strong estimation and assignment practices improve delivery prediction accuracy by nearly 40%
- Better planning reduces coordination issues by around 25%, improving execution speed
- Organizations that adopt structured planning frameworks improve planning accuracy by over 30%
What this means: Maximum utilization does not mean maximum output. Teams that leave room for flexibility perform better over time. Controlled workload leads to steady delivery and fewer failures.
How Does Work Allocation Impact Delivery Speed
How teams divide their time across tasks directly affects delivery speed and long-term performance. Teams that balance new development, improvements, and maintenance work deliver faster and avoid slowdowns. Poor allocation leads to delays, technical debt, and reduced output.
Key data:
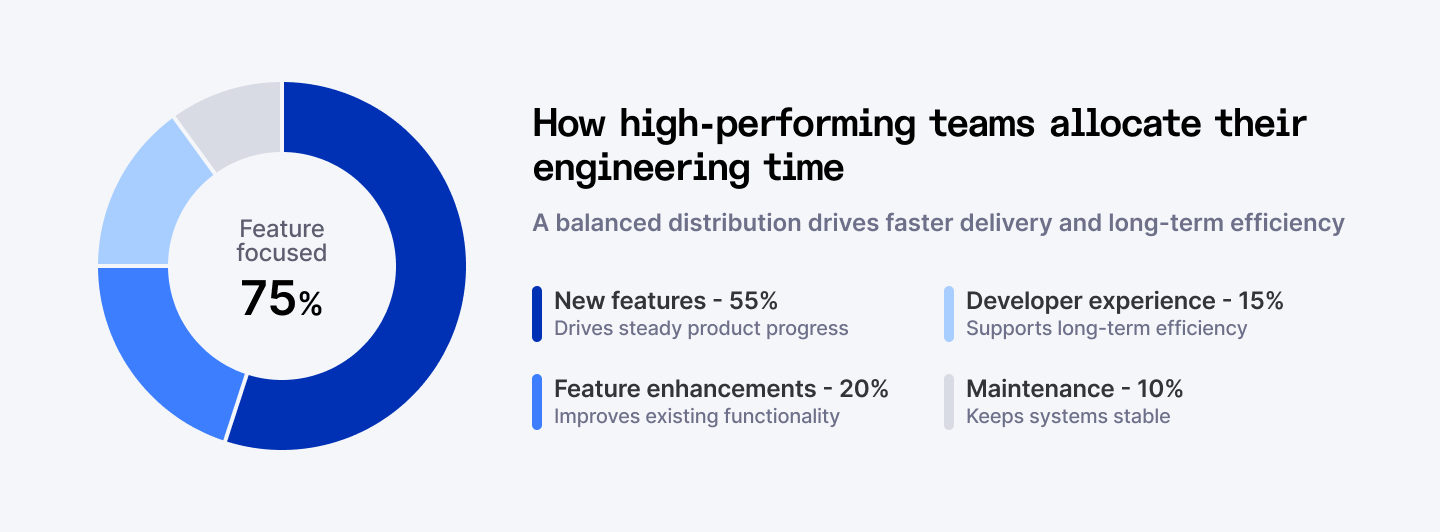
- High-performing teams spend about 55% of their time on new feature development, which drives steady product progress
- Around 20% of the time goes to feature enhancements, helping improve existing functionality
- Teams invest nearly 15% of effort in developer experience improvements, which supports long term efficiency
- Only about 10% of the time is spent on maintenance work, keeping systems stable without slowing delivery
- Teams that spend more than 25% of their time on maintenance often face slower delivery due to technical debt
- Balanced teams improve feature delivery speed by around 40% compared to poorly distributed teams
What this means: How teams spend time matters as much as how much time they have. Balanced allocation prevents technical debt and keeps delivery moving without long-term slowdowns.
What Is the Business Impact of Engineering Capacity
Engineering capacity does not just affect delivery speed. It directly impacts revenue, customer satisfaction, and overall business growth. Companies with strong engineering capacity deliver faster, compete better, and scale efficiently.
Key data:
- Global businesses could lose up to $5.5 trillion due to delays caused by tech talent shortages
- Around 90% of companies report difficulty in hiring and retaining skilled engineers
- The global shortage of software engineers is expected to reach over 1.2 million roles by 2026
- Companies with strong delivery practices achieve about 30% higher customer satisfaction
- These companies also see nearly 25% faster revenue growth due to quicker product releases
- Improved technology maturity can unlock up to 30% more business value through better productivity
What this means: Engineering capacity directly affects business results. Faster delivery leads to quicker market response, better customer experience, and stronger revenue growth.
⭢ Struggling with slow delivery cycles? Learn the 7 leadership moves that speed up software project delivery.
How Does Team Structure Affect Delivery Capacity
Team structure plays a key role in how efficiently teams use their engineering capacity. Well-structured teams reduce dependencies, improve coordination, and deliver faster. Poor structure creates delays, increases defects, and slows down product delivery.
Key data:
- Teams that shift to cross-functional models improve delivery speed by around 20% and reduce code defects by nearly 45%, which improves overall product quality
- Around 20% of team practices drive nearly 80% of delivery outcomes, showing how structure and processes shape performance
- Teams that adopt structured measurement systems reduce product defects by about 20% to 30% and improve employee experience by around 20%, these teams also increase customer satisfaction by up to 60%
- Teams that track goals regularly achieve targets about 70% more often than those that review progress less frequently
What this means: Structure decides how effectively teams use their capacity. Well-aligned teams reduce dependencies and move faster, while poorly structured teams lose time in coordination and rework.
Final Words
Engineering capacity improves when teams have the right people in place, not just better tools or processes. Many companies try to fix delivery issues through workflows, but hiring delays and skill gaps often slow progress.
The data shows that 90% of companies struggle to hire and retain talent, and the shortage is expected to cross 1.2 million roles by 2026. This directly reduces engineering capacity and delays product delivery.
Companies that solve hiring faster build stronger teams and maintain steady delivery. They ship quicker, reduce failures, and scale without bottlenecks.
If your team faces delivery issues, the problem is often not the process. It is the lack of the right talent at the right time.
The fastest-growing teams solve this by building strong hiring pipelines and working with partners who help them scale engineering capacity without delays.
➡︎ Struggling with slow product delivery despite growing your team? Index.dev helps you increase engineering capacity fast with verified engineers and AI specialists who plug into your workflow and start delivering from day one.
➡︎ If engineering capacity is on your radar, explore how staff augmentation trends are reshaping team structures in 2026, what smart scaling looks like after Series A funding, the real numbers behind AI-driven developer productivity, and which AI tech trends engineering leaders are prioritizing next.
Data Sources
- http://dora.dev/research/2024/dora-report/2024-dora-accelerate-state-of-devops-report.pdf
- https://jellyfish.co/resources/2024-state-of-engineering-management-report/
- https://linearb.io/resources/software-engineering-benchmarks-report
- https://www.worklytics.co/resources/software-engineering-productivity-benchmarks-2025-good-scores
- https://www.tecla.io/blog/tech-talent-shortage
- https://linearb.io/blog/software-development-metrics-guide
- https://stackoverflow.blog/2021/11/29/the-four-engineering-metrics-that-will-streamline-your-software-delivery/
- https://www.entrepreneur.com/article/390569
- https://fullscale.io/blog/engineering-productivity-paradox/
- https://www.mckinsey.com/capabilities/tech-and-ai/our-insights/how-high-performers-optimize-it-productivity-for-revenue-growth-a-leaders-guide
- https://uplevelteam.com/resources/engineering-kpis-wave
- https://getdx.com/blog/agile-velocity/
- https://linearb.io/blog/software-development-metrics-guide
- https://jellyfish.co/blog/engineering-management-in-2024-and-what-to-expect-in-2025/
- https://fullscale.io/blog/engineering-productivity-paradox/
- https://www.mckinsey.com/industries/technology-media-and-telecommunications/our-insights/yes-you-can-measure-software-developer-productivity
- https://linearb.io/blog/software-development-metrics-guide
- https://dora.dev/research/
- https://www.mckinsey.com/capabilities/operations/our-insights/taking-the-measure-of-agile-transformation
- https://fullscale.io/blog/engineering-productivity-paradox/
- https://www.mckinsey.com/
- https://resources.github.com/topics/developer-productivity/
- https://survey.stackoverflow.co/2024/
